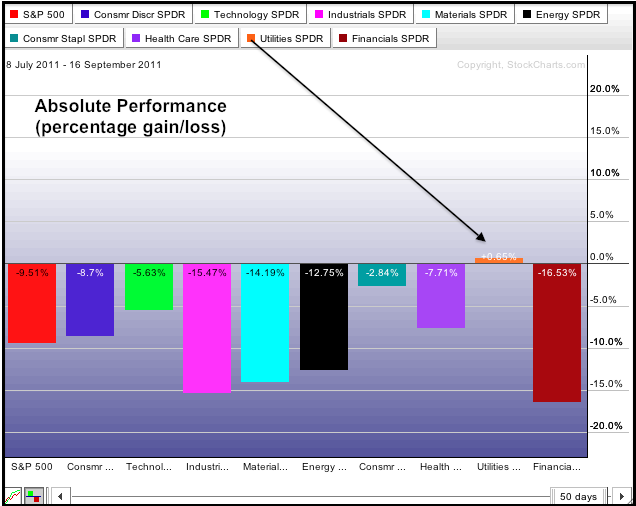
The S&P 500 peaked in early July and declined sharply into early August. There has been a rebound from this low, but all sectors are still down since July 8th – except one. The Utilities SPDR (XLU) is the only sector SPDR showing a gain since July 8th. The first PertChart shows absolute performance for the nine sectors and the S&P 500 over the last 50 days. The S&P 500 is down 8.51% and the rest of the sectors are down from 2.84% (Consumer Staples) to 16.53% (Finance). The Utilities SPDR (XLU), which is the highest yielding SPDR, is up .65% since July 8th. It ain't much, but it is better than a loss.


Click this image to see a live chart.
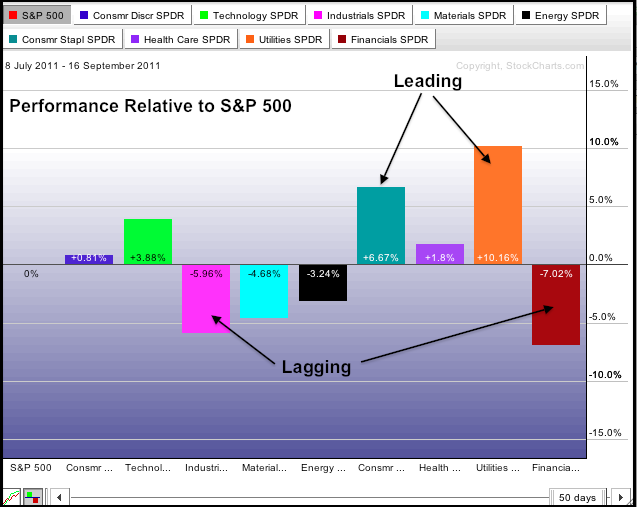
The second PerfChart shows the performance for these sectors relative to the S&P 500. Click the S&P 500 tab to move between absolute and relative performance. Sectors that are down less than the S&P 500 or up show positive relative performance. Sectors down more than the S&P 500 shows negative relative performance. Finance and industrials are leading the way lower and showing relative weakness. The consumer staples and utilities are holding up the best and showing relative strength. This shows a defensive oriented market that prefers safety and yield over return.
Take care,
- Arthur


