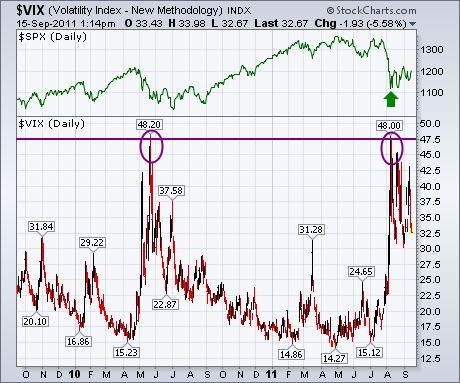
Two Thursdays ago (September 1) I wrote about the CBOE Volatility (VIX) having reached previous resistance formed during the spring of 2010 near 48. The chart below shows that the VIX has backed off from that overhead barrier which has helped stabilize the stock market (green arrow). In fact, the only time that the VIX moved significantly above the area around 48 was during the 2008 market meltdown when it reached 90. So this is an important test of whether the market is just in a normal downside correction or something more serious. Needless to say, a VIX close above 48 would have very negative implications for the market.
I also wanted to let everyone know that we've updated the StockCharts Market Summary page to better reflect the indexes, ETFs, and market indicators that I review on a regular basis. StockCharts subscribers can hear an audio message I recorded last week that goes over those changes by clicking on the Market Message tab at the top on any page on our site.
- John


