Hello Fellow ChartWatchers!
"Distance not only gives nostalgia, but perspective, and maybe objectivity." - Robert Mogan
Perspective. Do you have it? Have you lost it? How do you gain it back?
One of the best ways to gain perspective on the stock market is to use long-term market indicators. One of the best long-term market indicators I know of is the Bullish Percent Index ($BPNYA).
The Bullish Percent Index is the percentage of tradeable NYSE-listed stocks that currently have a "bullish" signal on the right edge of their Point and Figure chart. Click here for the gory details.
$BPNYA is a great indicator for quickly determining the overall "health" of the market. If it is moving higher, life is good. If it is moving down, hang on to your hats.
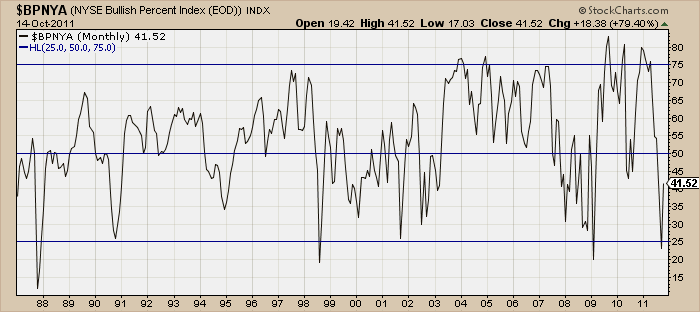
So where is the Bullish Percent Index now relative to where it has been in the past? Here's a monthly chart of $BPNYA going back to 1987. This chart is one of the best I've ever seen at telling "The Story of the Stock Market So Far..."
(Membes can click the chart to see a live monthly version. Non-members will see a daily version.)
This chart shows that the important levels for $BPNYA historically have been 25%, 50% and 75%. The index tends to stay between 25% and 50% (slow economic times) OR it tends to stay between 50% and 75% (good times). The current 41.52 rating shows some improvement over September's reading of 23.15 however there is a long ways to go. The indicator has also whipsawed above and below the 50% line many times in the past. As you can see from recent action in 2004 and 2009, a move above 75 is what is really needed in order to have confidence things won't immediately fall back below 50.
Every day we publish Bullish Percent numbers for the NYSE as well as 22(!) other stock categoies every day on our Market Summary End-Of-Day page. They are located at the bottom and all begin with "$BP". Make sure to add them to your market analysis arsenal.
- Chip


