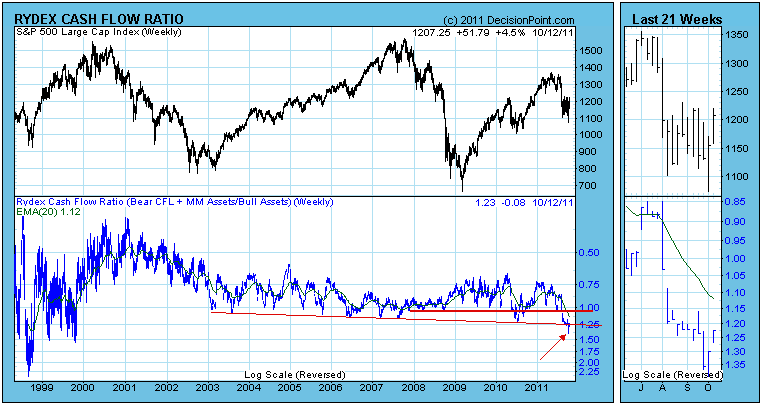
One of the ways we have of measuring sentiment is by tracking cash flow into and out of Rydex mutual funds through the use of our Rydex Cash Flow Ratio. The Ratio is calculated by dividing cumulative cash flow (CCFL) of Bear funds plus Money Market funds by the CCFL of Bull funds. We display the results on a reverse scale chart so that high Ratio readings coincide with price lows.
The chart below shows that at the October price lows the Ratio went lower than any time since the 1999 correction. Recent Ratio lows were more extreme than two previous bear market lows, and extremes like that are a sign that sentiment is getting very bearish. Unfortunately, the recent Ratio low exceeded the normal range of the last nine years, so we have to wonder if the limits of the range are expanding permanently.
The above chart displays our entire history of the Ratio, and obviously the range was much wider in the early days. The reason for this was that there were fewer assets in Rydex funds back then, which allowed for a more volatile Ratio.
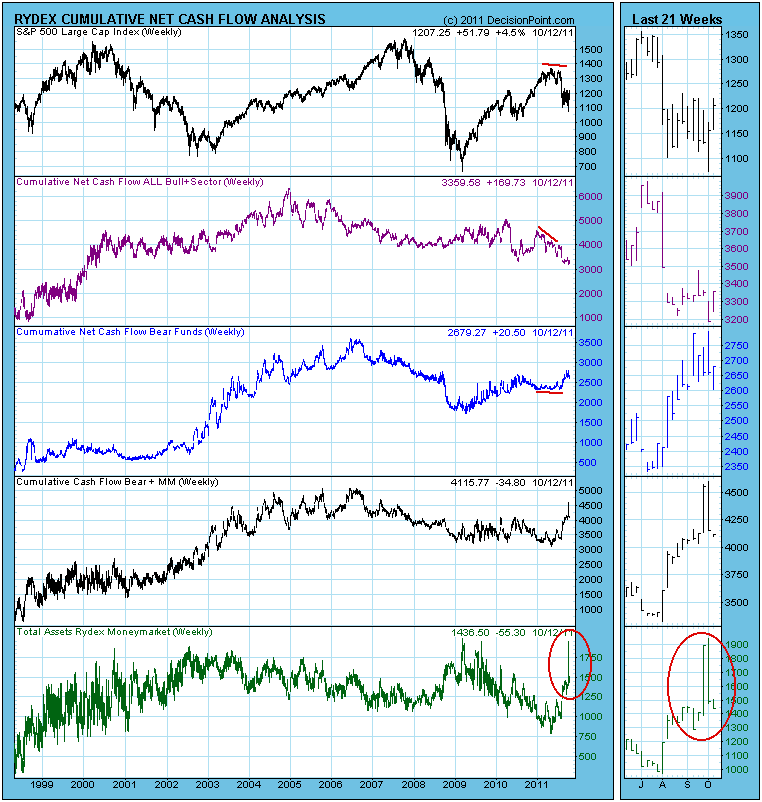
The chart below shows the components of the Ratio calculation. Note that as the market was topping, Bull CCFL fell and Bear CCFL flattened. Then as the market crashed, Bull CCFL decreased, and Bear CCFL increased, as expected.
The really significant feature on the chart is the sharp increase in Money Market fund assets as people ran to safety. The next most interesting feature is that (see the thumbnail chart on the lower righ corner of the chart) all that recent inflow has moved out of the Money Market fund and, presumably, back into the Bull funds.
Bottom Line: The Ratio is well off its recent lows, but it is still reflecting very strong bearish sentiment, and this is confirmed by Investors Intelligence Advisor Sentiment and NAAIM Sentiment as well. This taken with other indicators we discussed earlier this week, we believe that the Ratio has signalled an important price low.


