The weekly moving average convergence divergence (MACD) has always been a favorite indicator of mine. It provides a "big picture" outlook of the market and helps me take a step back from the day to day swings of the market. With the Volatility Index (VIX) in the stratosphere and closing close to 43 on Friday, the whipsaw action is quite unnerving. Taking a step back and looking at the big picture helps to ease some of that daily stress and makes it easier to focus on an appropriate trading strategy. I realize the MACD is only one indicator, and it won't always be right, but it does increase the odds of a particular move and helps me determine when it makes sense to take on more risk.
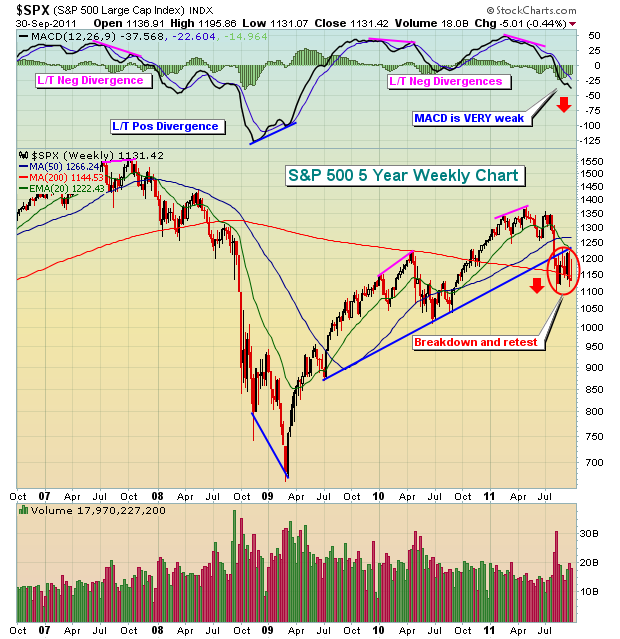
Below is a chart of the S&P 500 on a weekly basis for the past 5 years:

Note that all the MAJOR moves over the past 5 years were preceded by either a long-term positive or negative divergence. Currently, the weekly MACD is pointing straight lower and is clearly bearish. This tells us that the 12 week EMA is diverging from the 26 week EMA, a sign of accelerating bearish momentum. While it's not impossible for the market to bottom during such accelerating bearish momentum, I'd say it's rather unlikely.
There are a number of critical "below the surface" types of signals - like the weekly MACD - that will tell us ahead of time when the market has bottomed or is approaching a bottom and is poised to move higher. Those signals are a MUST for anyone who seriously trades the market. I've developed a new educational video series that will enable you to spot these reversals BEFORE they happen. CLICK HERE to register for this series.
Happy trading!
- Tom


