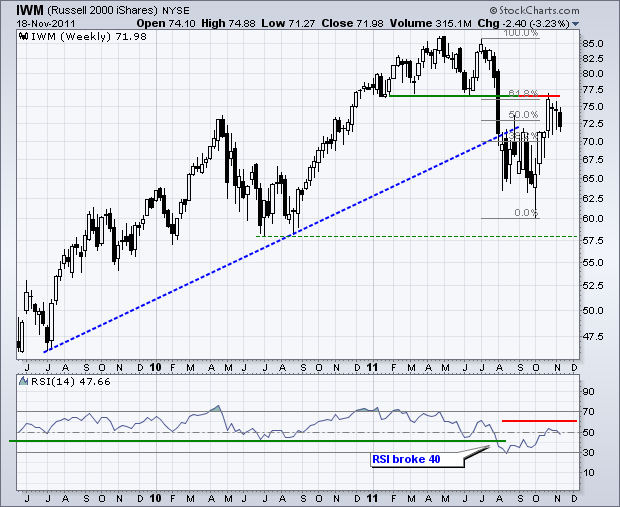
A number of bearish developments have emerged on the weekly chart for the Russell 2000 ETF (IWM). This weekly chart extends two and a half years to cover the long-term situation. First, the ETF broke support with a sharp decline in August and then exceeded the July 2009 trendline. Second, the subsequent bounce met resistance near broken support and the 61.80% retracement. This is what would be expected from a counter trend advance within a bigger downtrend. Third, RSI broke below 40 for the first time since the rally began 2009. The 50-60 zone now becomes resistance.
Click this image for a live chart.
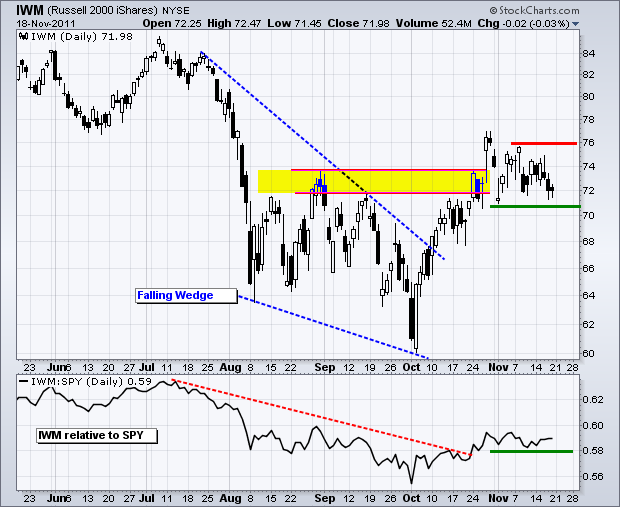
Despite potentially bearish developments on long-term chart, IWM remains in an uptrend on the daily chart, which captures the medium-term trend. The next chart shows IWM breaking above its resistance zone with the late October surge. The ETF became quite overbought with this surge and then consolidated the last four weeks. The break from this consolidation holds the next key. An upside breakout would signal a continuation of the October advance and target a move to the summer highs. Conversely, a break below consolidation support would have medium and long term implications. First, resistance on the weekly chart would be reinforced. Second, a reversal of the October-November advance would signal a continuation of the long-term downtrend. This would target a move below the October low.
Click this image for a live chart.
Good trading,
Arthur Hill CMT


