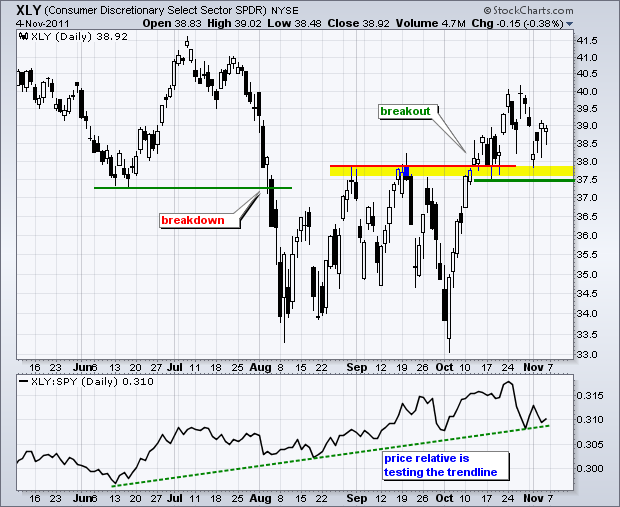
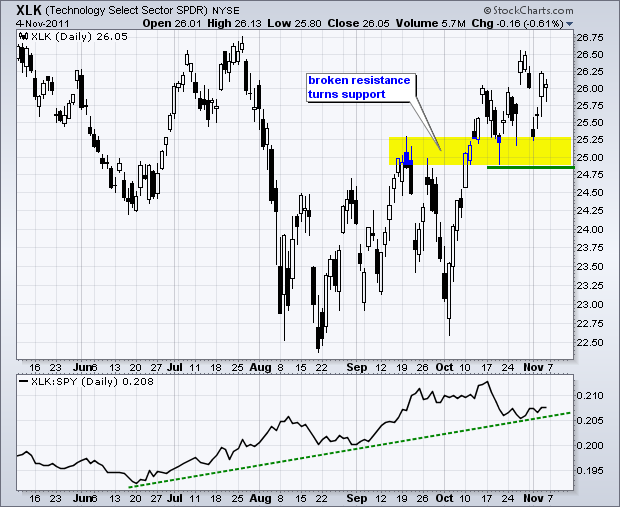
Earlier this week I noted that the Nasdaq 100 ETF, the Russell 2000 ETF and the S&P 500 ETF were testing broken resistance. The October surges produced breakouts and it is important that these resistance breakouts hold. Basic technical analysis teaches us that broken resistance levels turn into support. Failure to hold these breakouts would be a sign of weakness. Looking at the key offensive sectors, I see similar support levels from broken resistance. These levels are holding so far and these SPDRs have established similar support zones with the lows of the last few weeks. The offensive sectors include consumer discretionary, technology, finance and industrials. In particular, I am focusing on the consumer discretionary and technology sectors. The first chart shows the Consumer Discretionary SPDR (XLY) breaking a resistance zone around 38 and this zone turning into a support zone. A break below 37.5 would reverse the October upswing and question the validity of the October breakout. The indicator window shows the Price Relative trending higher. Notice that this indicator is testing trendline support. A break would indicate that the consumer discretionary sector was moving from leader to laggard. The second chart shows the Technology SPDR (XLK) with similar characteristics.
Click this image for a live chart.
Good trading,
Arthur Hill CMT


