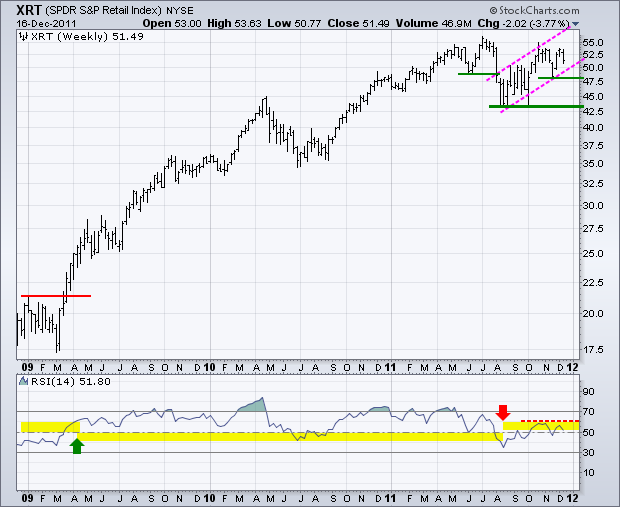
The Retail SPDR (XRT) remains one of the strongest ETFs in the market. As a core part of the consumer discretionary sector, retail is one of the most important industry groups and Christmas is perhaps the most important season. A lot is riding on the consumer this holiday season. The chart below shows XRT bouncing off support in the 42.5 area and working its way back above 50. A rising channel has taken shape with support marked at 47.50. The bulls are in good shape as long as prices hold this rising channel. A move below 47.5 would break channel support and argue for a continuation of the summer decline. This would be a bearish development for retailers, the consumer spending outlook and the broader market.
Click this image for a live chart.
The indicator window shows 14-period RSI. Notice that RSI broke above 60 in April 2009 to turn momentum bullish. Once bullish, RSI oscillated between 40 and 80 during the bull run. Andrew Cardwell, a noted RSI expert, notes that RSI oscillates in bull zones and bear zones. A bull zone extends from 40 to 80, while a bear zone extends from 20 to 60. Notice that RSI moved below 40 with the summer breakdown and is now hitting resistance in the 50-60 zone. This puts RSI in a bear zone and sets up a big test for momentum. A break above 60 would turn momentum bullish again, while a break back below 45 would be bearish.
Good trading -- Arthur Hill CMT


