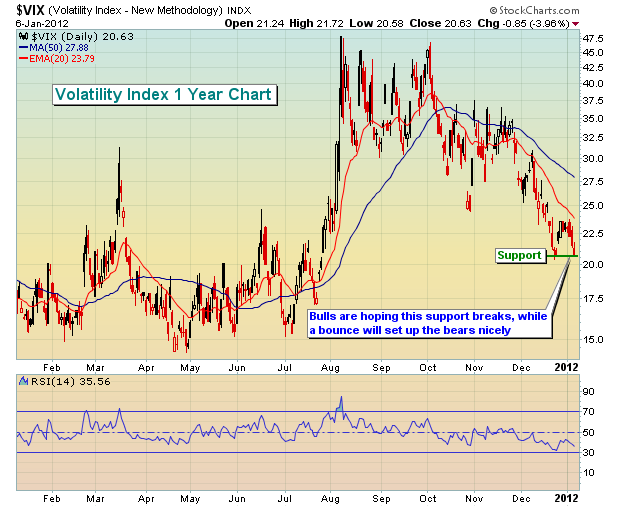
High volatility is generally associated with declining equity prices. The inverse is true as a declining level of volatility emboldens the bulls. Therefore, I follow the VIX continually to get a sense of DIRECTION. Clearly, the volatility index (VIX) has been trending lower over the past few months. So it should come as no shock that the fourth quarter of 2011 produced the best quarterly results on the Dow Jones in more than a decade. But one week into 2012, the VIX is hitting support. Check out the chart below:
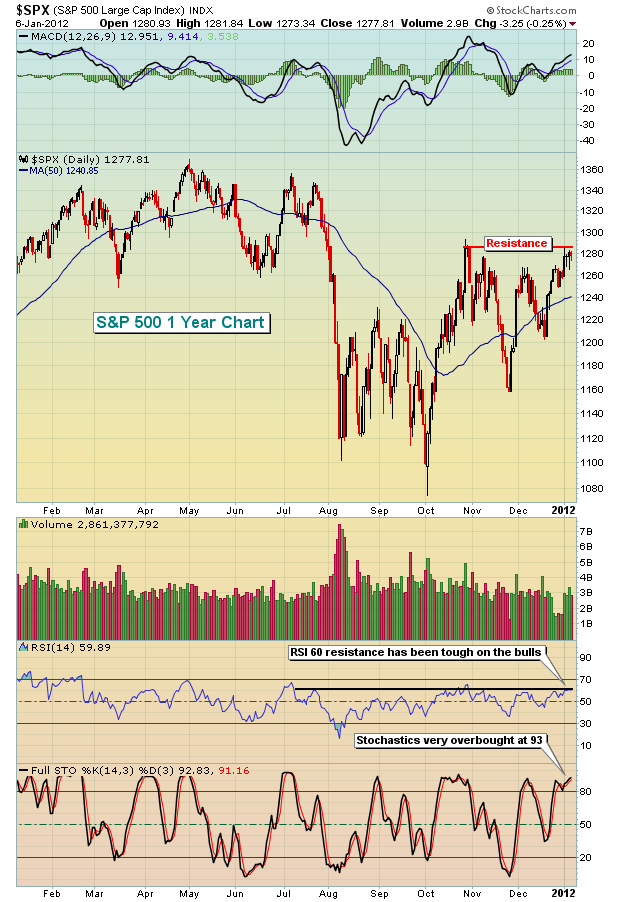
A rising VIX is bad news for bulls. And after the huge move lower in the VIX, it hit support on Friday. A simple bounce off oversold VIX conditions would likely lead to selling in equities just as we near resistance on a couple key indices. The following shows the near-term resistance that the bulls are facing on the S&P 500 as a new trading week unfolds:
It seems that each time that stochastics and RSI hit 90 and 60, respectively, the bulls run into trouble extending the rally. Currently, that's where both of our momentum oscillators reside.
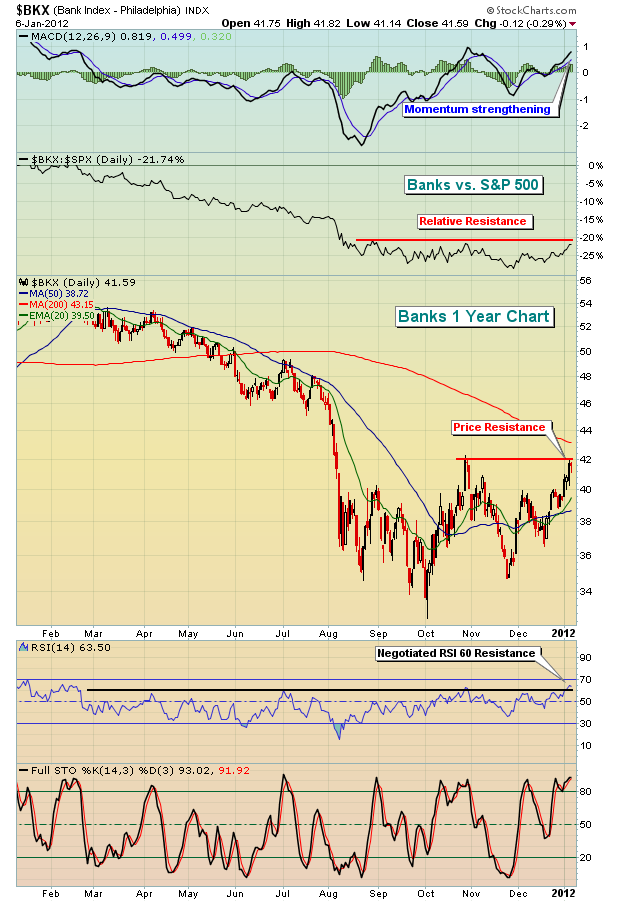
A key sector in the S&P 500 is financials and the performance of the banking industry is important to the overall health of the market. Banks have also touched a critical resistance level that will need to be negotiated if the recent rally is to continue. Take a look:
The banks have an opportunity here, as they did in late October, to build on strengthening relative momentum. Banks failed in October, but will they be able to sustain their recent strength? The MACD once again has crossed above the centerline, which hasn't happened often the past several months. But more important than improving relative strength is the potential of an actual price breakout above key price resistance. A price-volume breakout trumps all other technical indicators in my opinion. Therefore, keep a very close eye on the 42 resistance level on the Bank index.
Many traders enjoy the prospects of higher returns by trading leveraged ETFs. While I believe their use should be limited, there are occasions when significant support or resistance are hit where they make sense from a reward to risk perspective. Given the level of resistance on the Dow Jones US Financial Index, we could be approaching a time to look at the UYG or SKF, depending on whether a breakout is made or not. I've made the argument for considering a position in these financial juiced ETFs and am happy to share it with you. Click here for more details.
Happy trading!


