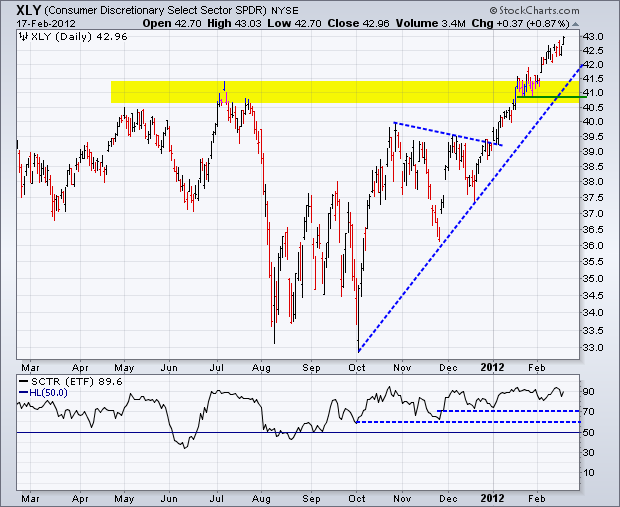
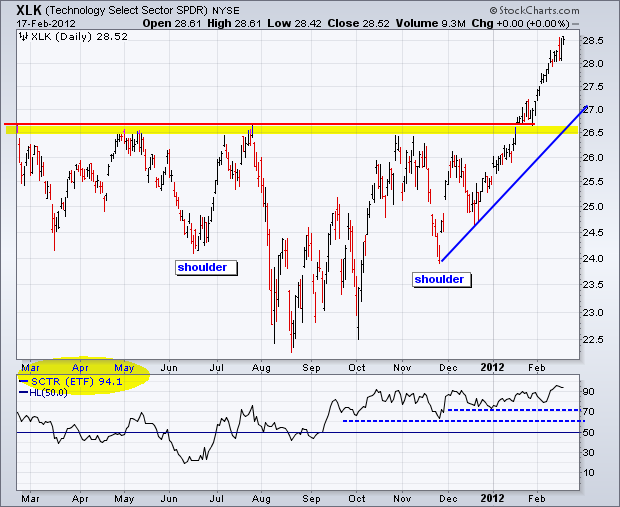
Of the nine sector SPDRs, the Consumer Discretionary SPDR (XLY) and the Technology SPDR (XLK) have the highest StockCharts Technical Rank (SCTR). The SCTR for the Industrials SPDR (XLI) is in a close third. High SCTR scores indicate that these sectors show excellent relative strength and market leadership.
Click this image for a live chart.
The first chart shows the Consumer Discretionary SPDR (XLY) breaking above its 2011 highs in January and extending further in February. While the advance is getting overextended, this key sector is by no means weak. Broken resistance turns into the first support zone around 41. The indicator window shows the SCTR plot. In general, the security shows some relative strength when above 50 and some relative weakness when below 50. Notice that this indicator has been above 60 since early October and above 70 since late November. The SCTR is currently at 89, which indicates that this sector shows exceptional relative strength.
Click this image for a live chart.
The second chart shows the Technology SPDR breaking resistance from a large inverse head-and-shoulders pattern. Broken resistance turns first support in the 26.50 area. The SCTR moved above 60 in mid September and never looked backed. It has held above 70 since late November and is currently above 90, which makes it the leading sector. You can see all scores on the SCTR table page and read more about SCTR in our ChartSchool.


