ChartWatchers

ENERGY SHARES START TO SHOW RELATIVE STRENGTH

 | 

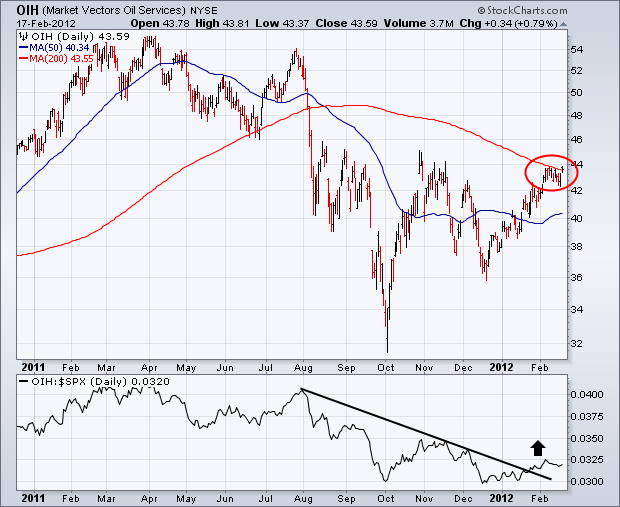
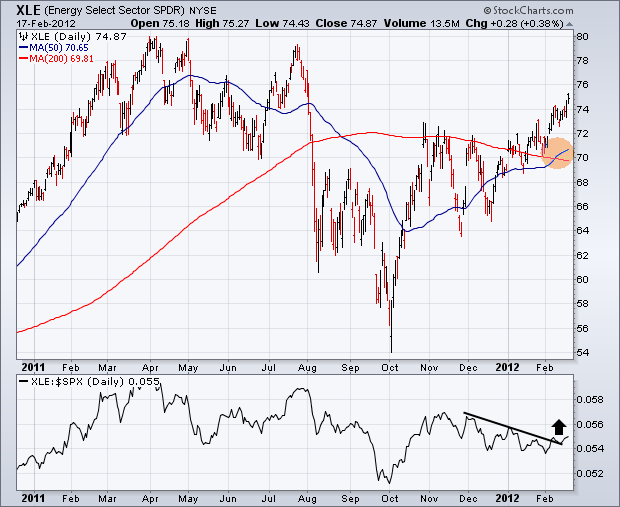
Energy shares were this week's strongest market sector. That's the first time we've seen relative strength by the energy sector in three months. Chart 1 shows the Energy Sector SPDR (XLE) trading at the highest level in seven months. [A "golden cross" has also been formed by the 50-day average rising above the 200-day (gold circle)]. The line along the bottom is the XLE/SPX ratio, and shows it breaking a three-month down trendline. That's a sign that money is starting to move into this sector more aggressively. Chart 2 shows the Market Vectors Oil Services ETF (OIH) very close to breaking through its 200-day average (red circle). Its relative strength ratio (below chart) is also starting to rise.

20120218001-sc

20120218002-sc

John Murphy
About the author: is the Chief Technical Analyst at StockCharts.com, a renowned author in the investment field and a former technical analyst for CNBC, and is considered the father of inter-market technical analysis. With over 40 years of market experience, he is the author of numerous popular works including “Technical Analysis of the Financial Markets” and “Trading with Intermarket Analysis”. Before joining StockCharts, John was the technical analyst for CNBC-TV for seven years on the popular show Tech Talk, and has authored three best-selling books on the subject: Technical Analysis of the Financial Markets, Trading with Intermarket Analysis and The Visual Investor. Learn More
Subscribe to ChartWatchers to be notified whenever a new post is added to this blog!
comments powered by Disqus