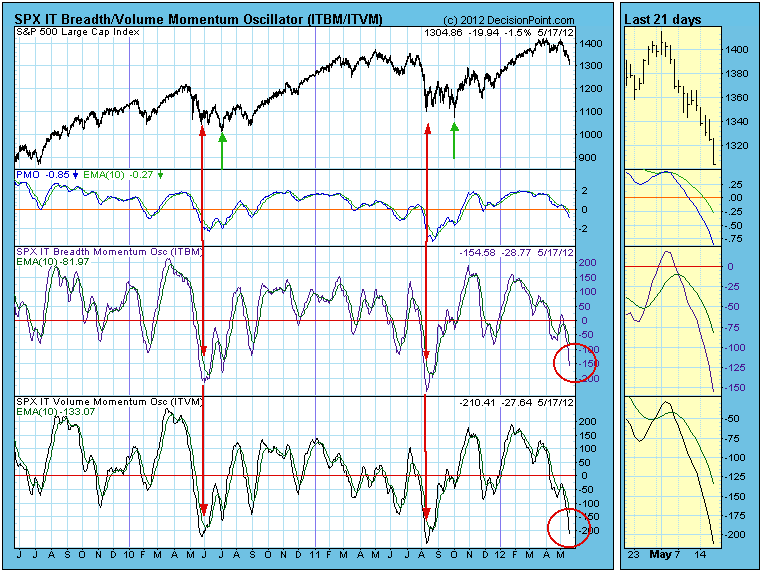
The current correction is creating very oversold conditions on intermediate-term indicators, like the ITBM (breadth) and ITVM (volume). While oversold indicators often signal final price lows for a correction, extremely oversold readings are a sign that the price low for the correction probably won't arrive until weeks after the extreme indicator lows.
On the chart below I have annotated two very good examples of this process. The red arrows show where indicator lows occurred, and the green arrows show the correction price lows, which arrived several weeks later after prices bounced out of the first low.
While a simialr circumstance seems to be setting up at present, in order to replicate the two previous examples I think the ITBM and ITVM need to go down a little more, and the PMO (Price Momentum Oscillator) needs to go down a lot more.
Conclusion: Current oversold indicator readings may offer hope that we will soon see a low for this correction; however, oversold conditions are approaching such extreme levels that we should anticipate that the correction will continue for several weeks before a significant low is reached.
We should also note that the two examples cited occurred during a bull market advance. If a bear market has begun, the resolution could be much more severe.


