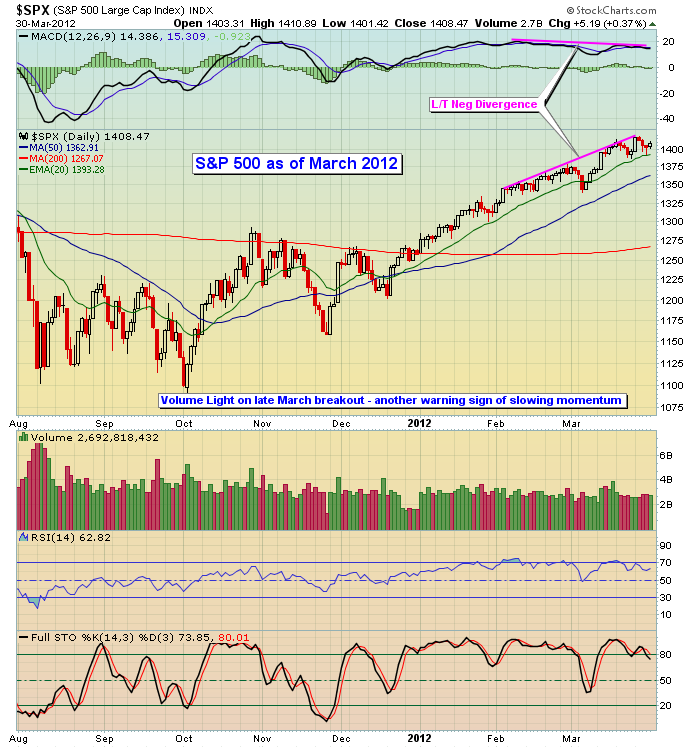
The long-term negative divergences that printed in February and March provided us clues that we'd at least see some near-term trepidation and possibly something much worse. Well, the "much worse" has arrived. There is no technical sign - bullish or bearish - that ever provides us a guarantee so a bit of cautious skepticism can go a long way for a trader. But things have changed and from a risk perspective it's certainly time to consider changing your investing or trading strategy.
When a market trends higher and the MACD gives us the "full speed ahead" sign, I tend to be more aggressive on the long side. When warning flags go up (ie, long-term negative divergences), it's ok to remain somewhat bullish, but it's important to adjust to a higher level of risk in the market. In such circumstances, selling calls against long positions make sense to reduce risk. Those who are not interested in trading options can simply sell a portion of their positions to raise cash. Then we sit back and wait to see if the higher risk translates into a bounce off key support or if the market transitions into a period of higher uncertainty and more selling. This past week, all or our major indices suggested we are clearly in that period of higher uncertainty.
What that means to me is that we'll see added volatility and more whipsaw action with both longs and shorts being regularly confused.
Let's take a look at the recent progression from what I considered to be a very strong and bullish market to one that now has turned much more bearish. First, check out the S&P 500 in early 2012:
This type of long-term negative divergence absolutely sends a warning signal. But these bearish divergences usually do not provide us long-term signals. They tell us that momentum has waned in the near-term and that a short-term period of consolidation, or perhaps a period of bearishness, is to be expected (not guaranteed). It's what happens AFTER these signals that usually drives market action in the foreseeable future. In other words, can the MACD test its centerline support to "reset" the difference between the 12 day EMA and 26 day EMA back to zero. That's the definition of a MACD centerline test. Does the bullish momentum resume or do we see a bearish MACD centerline crossover that indicates momentum has turned in favor of the bears?
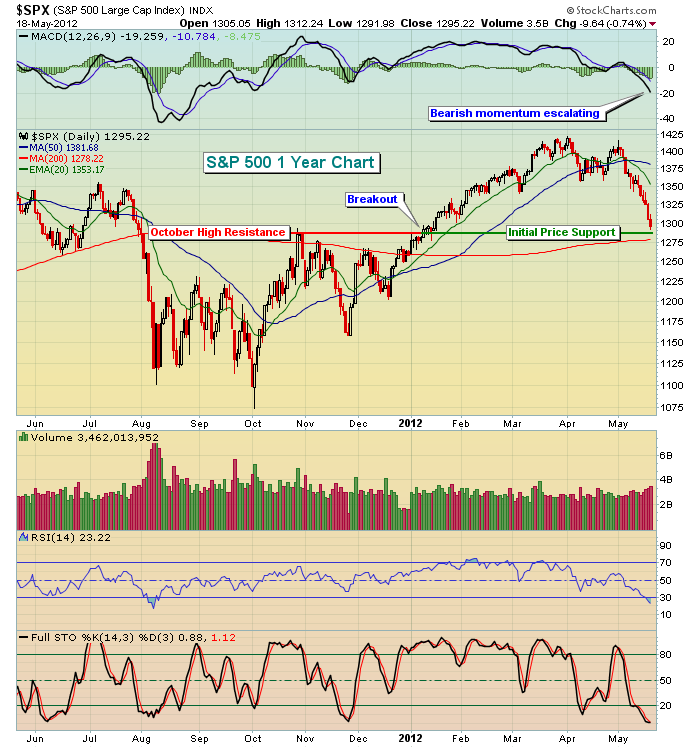
For that answer, take a look at the current technical picture of the S&P 500:
A few technical items stand out to me. First, the long-term negative divergence that indicated slowing momentum in March served as an important signal and it proved correct. Next, the subsequent decline in equity prices did test key moving averages like the 50 day SMA and we did see the MACD move back to key centerline support. The problem, however, is that the selling was not contained there. It was just beginning. Finally, check out the MACD on last week's selling. Momentum is accelerating to the downside. Because momentum now is so strong in favor of the bears, we cannot expect much more than an oversold bounce. I feel fairly confident that we will get a bounce and it'll likely move the S&P 500 towards its declining 20 day EMA. At that point, however, it'll be time to short - perhaps even aggressively - until the market proves to us otherwise.
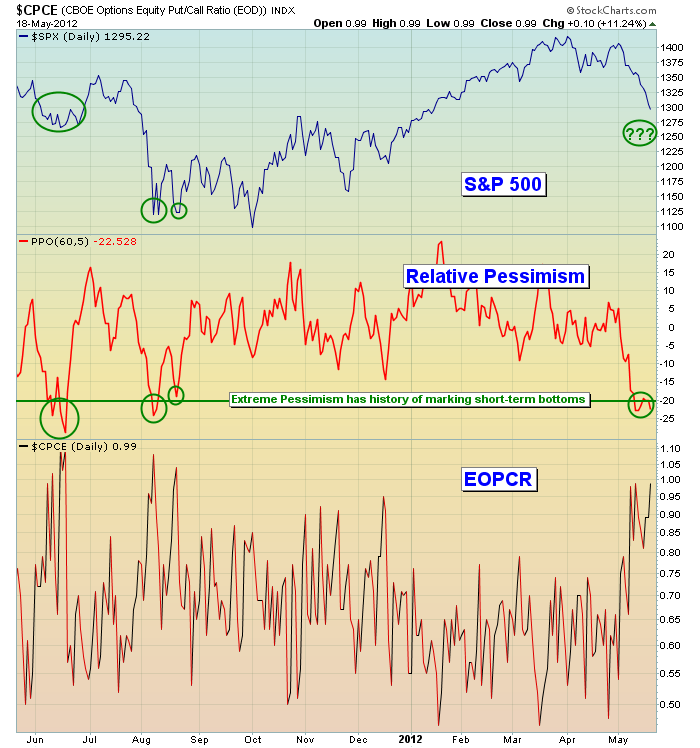
The bulls have two signs on their side as we begin a new trading week - oversold conditions and sentiment. It appears we need a capitulatory type of selling day in order to establish a short-term bottom. That will give us an opportunity to unwind what has become VERY oversold short-term conditions. It's not often when you see three of the major indices - S&P 500, NASDAQ and Russell 2000 - with its stochastic reading below 1, combined with RSI readings mostly in the low 20s. That's POWERFULLY oversold. But perhaps even more significant is the fact that options traders are piling in on the equity put side. You should know by now how closely I follow the equity only put call ratio (EOPCR) and my calculation of relative pessimism. Relative pessimism has a solid track record in helping to spot short-term market bottoms. It did it in both June and August of 2011 and is primed to do it again. Check this out:
I can tell you that my approach to trading has changed. I'm not writing off the possibility of a further move to the upside in 2012, but the market needs to prove that possibility to me first. For now, I consider bounces to be shortable. To give you an idea of what I look for in a short candidate, consider ANSYS, Inc. (ANSS), which was a short candidate and presented as a Chart of the Day on Thursday of last week. CLICK HERE for further details.
Happy trading!


