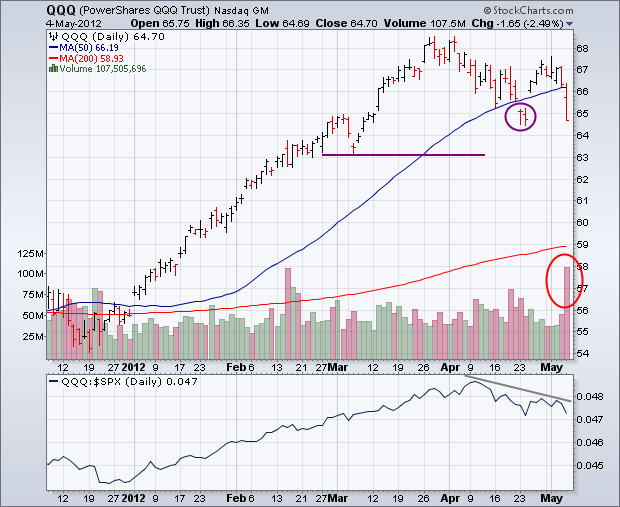
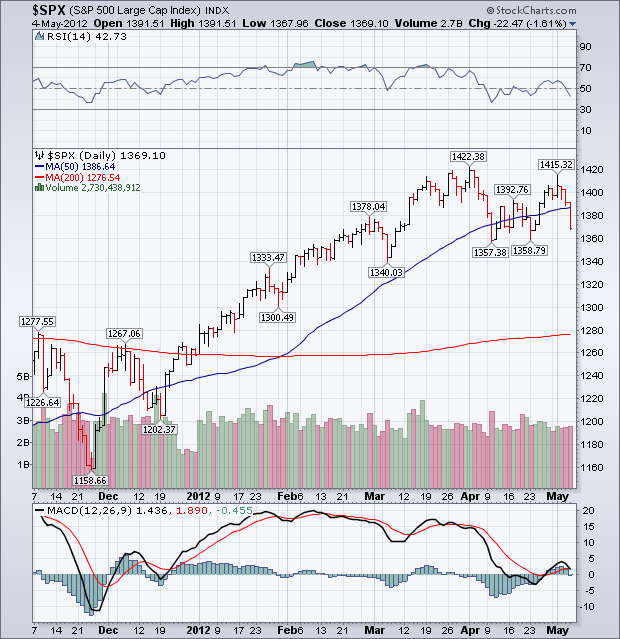
It looks like traders and investors took the "sell in May" mantra seriously this week. Stocks fell sharply after Friday morning's weak April jobs report was released. The worst performance came in the Power Shares QQQ Trust which led the rest of the market lower. Chart 1 shows the QQQ tumbling 2.5% on Friday on huge trading volume. That's a bad combination. In addition, the QQQ fell well below its 50-day moving average (blue line) and negated the "island reversal" that formed the previous week (see top circle). That puts the April low in jeopardy. A close below that low would initiate a pattern of "lower highs and lower lows" which is symptomatic of a deeper correction. The next level of potential support would then be the early March low near 63. The QQQ/SPX relative strength ratio (below Chart 1) also shows the QQQ underperforming the S&P 500 over the last month. That shows loss of leaderhip by the technology sector which is another negative development. Chart 2 shows the S&P 500 falling back below its 50-day line after failing a test of its April high. It too fell below its 50-day line. A test of its April low now appears likely. From a sector standpoint, technology was the week's worst sector. Energy and materials were close behind and were weighed down by falling commodity prices. The three top sectors -- utilities, consumer staples, and healthcare -- are all defensive sectors. That type of defensive rotation is consistent with market weakness. Bonds rallied as stocks fell, while gold attracted some safe haven buying. The dollar bounced a bit on Friday as the Euro weakened.


