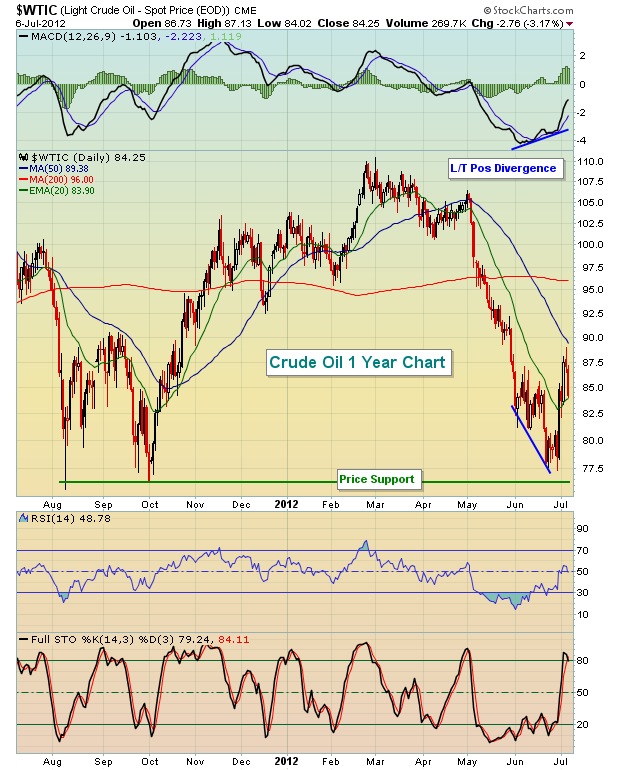
Reasonably bullish signs have emerged, the latest being that crude oil prices (finally!) found support at 2 year lows near $76-$77 per barrel. Not only was price support tested, but slowing momentum was obvious in the form of a long-term positive divergence. It's always nice to see corroborating technicals align bullishly and that's exactly what we saw with crude oil prices. Take a look:
After a long-term positive divergence prints on a daily chart, I look for a test of the 50 day SMA. Many times this coincides with a centerline test, or MACD "reset". As you can see above, crude oil surged very close to its 50 day SMA and the MACD is currently rising and approaching a key MACD centerline test and reset. A long-term positive divergence doesn't have to mark a long-term bottom, although many times it does. What happens after this 50 day SMA test is critical technically. The printing of a higher low and a later breakout above $89 per barrel would signal not only higher crude oil prices, but also resumption of the S&P 500 uptrend. Alternatively, a breakdown beneath $76 per barrel would indicate slowing global demand, which in turn would likely send the S&P 500 spiraling down close to 1200. Currently, I'm banking on the former because of the longer-term bullish backdrop.
In addition to the short-term bullishness, the longer-term 5 year weekly chart is also arguing for higher equity prices in the days and weeks ahead. Crude oil prices and the S&P 500 tend to move together. Crude oil prices move higher in anticipation of greater global demand. Higher demand usually results from strengthening global economies. Strengthening economies normally produce higher corporate profits, which in turn send S&P 500 prices higher. Take a look at the fairly tight correlation between crude oil prices and the S&P 500 on this chart:
If oil prices and the S&P 500 do eventually move higher, energy stocks will certainly benefit. I've highlighted one such stock poised technically for appreciation as my Chart of the Day for Monday, July 9, 2012. CLICK HERE to view the Chart.


