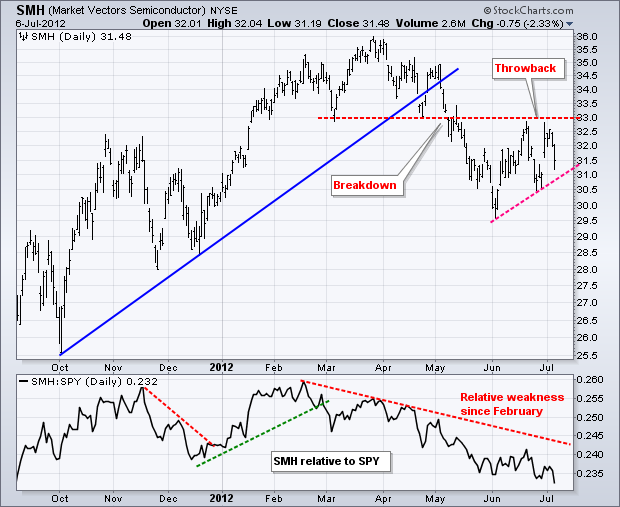
Relative weakness in the **Networking iShares (IGN)** and the **Market Vectors Semiconductor ETF (SMH)** weighed on the technology sector this week. The chart below shows SMH breaking down in May and then bouncing back to broken support in mid June. While SPY moved above its mid June high, SMH did not and showed relative weakness. The support break held and resistance has been affirmed at 33 with the decline on Thursday-Friday. The indicator window shows the SMH:SPY ratio peaking in February and moving to a new low today. Semis represent a key technology group and a cyclical industry. Relative weakness is negative for the market overall.
Click this image for a live chart.
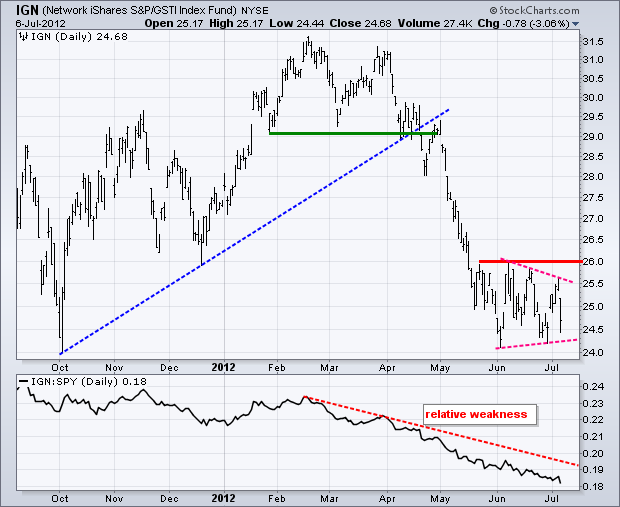
The second chart shows the Networking iShares (IGN) falling over 3% on Friday. Notice that IGN broke down in April, which was well ahead of the broader market breakdown in May. The ETF declined to its October low in early June and then firmed the last five weeks. While the broader market moved higher in June, IGN stalled and could not break above 26. This showed relative weakness, which is confirmed by the steady decline in the Price Relative (IGN:SPY ratio). The Nasdaq and technology sector are not going far unless these two key ETFs can break above their June highs.


