Decision Point publishes a daily Tracker report of our 152 Blue Chip list. This list is composed of the stocks in the S&P 100 Index, the Dow 65, and some large-cap Nasdaq stocks. We also track the Top 10 stocks in ths list, ranked by relative strength measured by Decision Point's proprietary PMO (Price Momentum Oscillator).
I have observed this list over a long period of time, and my impression has been that the top stocks do exceptionally well during a bull market, and extremely poorly in a bear market; however, I wanted to develop a more objective way to measuring the performance of these top stocks.
To do this I constructed a "Blue Chip Top 10 Index". This is done by calculating the daily change of the Index as being the daily average percent change of the securities in the Blue Chip Top 10 list. Stocks are tracked from the day after they enter the Top 10 list through the day they drop off the list.
The Top 10 Index is equally weighted, so theoretically one could only replicate the performance of the list with real money by reallocating an equal amount to each stock each day (and somehow avoid transaction fees in the process). More to the point, the Top 10 list are a good place to look for securities that will out-perform the market, but it will be impossible for you to duplicate the Index. You could also lose a ton of money if you are long these top ranked securities during an extended market decline.
The primary purpose of the 152 Top 10 Index (BC Top 10) is to how see well these top ranked large-cap stocks are doing in relation to the broader market. Specifically, in a bull market or extended rally we expect the Index to out-perform the broad market. This is because, when stocks reach the top of the list, they tend to stay on top due to persistent upward momentum. This is a healthy condition. In an unhealthy market, stocks tend to rotate through the Top 10 rather quickly, and the performance of the index poor in relation to the broad market.
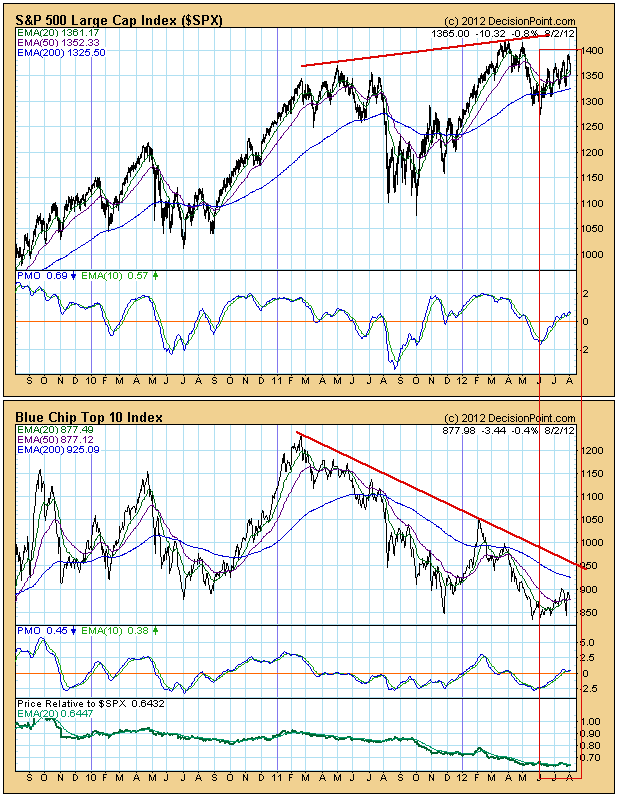
Comparing three-year charts of the SPX and BC Top 10 Indexes we can see that the Top 10 have been underperforming for the entire time. Since the June low the BC Top 10 has advance only 5.9% versus 9.5% for the SPX. And while the SPX has been trending up for the period shown, the BC Top 10 has been trending down since the February 2011 top.
Conclusion: In spite of upward movement of the SPX, the Blue Chip Top 10 Index tells us that the leadership of the market has been rotating too rapidly, which suggests confusion and weakness. By the time a stock reaches the Top 10, it loses momentum and drops right back out again. This is evidence that for a long time the internal condition of the market has been turbulent and confusing, in spite of generally rising market prices.


