Hello Fellow ChartWatchers!
Today I'm happy to announce that we've started rolling out several important new features for our SharpCharts charting tool. These new features include more choices for bar periods and an improved version of our interactive "Inspector" tool.
I'm even more pleased to announce that this is just the beginning of the big announcements for this upcoming week. Of course, at the end of the week we are holding our annual "ChartCon" conference here in Seattle. In addition to being a great event for everyone that attends, ChartCon provides us with a unique opportunity to annouce and demonstrate new features to a live audience of great StockCharts users.
So in preparation for ChartCon, we've been working hard to complete a long list of significant improvements to the website.
The first couple of changes happened last week when we released several new and updated color schemes for SharpCharts including our newest scheme called "Solar."
Next, we added a 2 year option to our subscription plans. These non-refundable 2-year plans drop the "per-month" cost of our service even lower by including 3(!) additional months for free. So if you use our 2-year plan for our ExtraRT service, you'll save $213.55 over the month-by-month cost. Basic members can save $103.70 via the 2-year option.
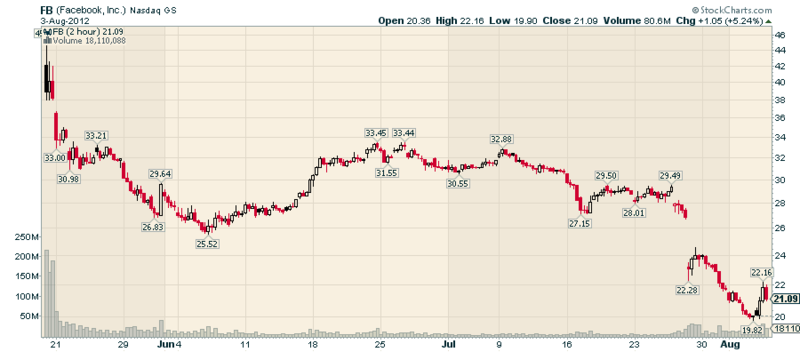
Yesterday, we added three new time period choices to SharpCharts for our members. In addition to the nine period choices thay are used to, members can now create charts with 2-minute, 3-minute, and 2-hour bars. Here's an example of a 2-hour Solar chart for Facebook going back to its IPO:
(Click the chart for a live version.)
On Monday, we plan on officially releasing a new blog called "The Best of s.c.a.n." which will contain edited "Question and Answer" articles from the "StockCharts Answer Network," our user-to-user help forum. We've combed through all of the great information on s.c.a.n. and we have selected some of the best, most informative articles that everyone should read as entries in this new blog. Again, watch for its official debut on Monday.
Now, who would like some new indicators? Well, we have 8 powerful new indicators headed your way. They should arrive by Tuesday and will be available free of charge to everyone. They are:
- Coppock Curve
- Ease of Movement (EMV)
- Know Sure Thing (KST)
- Mass Index
- Negative Volume Index (NVI)
- True Strength Index (TSI)
- Ulcer Index
- Vortex Indicator
It will take us some time to get the ChartSchool articles for these indicators created. In the mean time, you can learn more about them in Wikipedia. Again, look for them to appear on Tuesday.
What's up for the rest of the week? How about parabolas and rotating, translucent shapes in our ChartNotes tool? How about having the workbench colors match the colors on your chart? How about technical alerts? How about the ability to create your very own index? And how about a whole new service level that shatters all of the limitations of our current system?
All I can say right now is "Stay tuned!" This will be - by far - the BIGGEST week ever for StockCharts.com in terms of new announcements.
- Chip
P.S. If you live in the Seattle area and want to become a better chartist, there are still some seats available for ChartCon 2012 because of some last-minute cancellations. So, despite what it says on the website, we can still get you in if you want to sign up. ChartCon will be this Friday and Saturday in downtown Seattle. Click here for more info.


