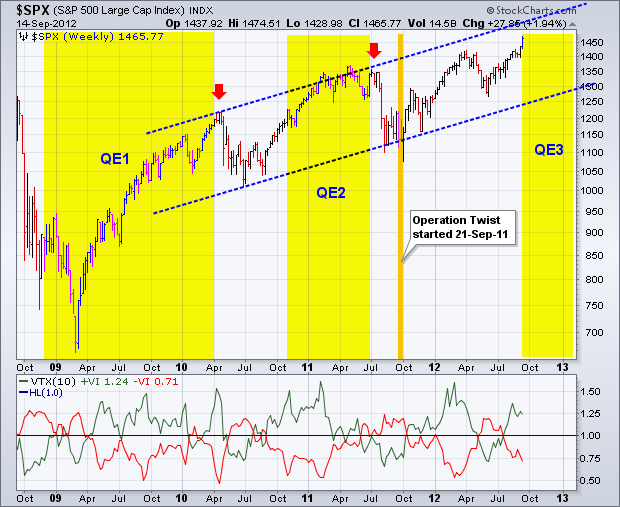
Stocks surged on Thursday after the Fed announced another round of quantitative easing, and extended their gains on Friday. Obviously, the stock market is pleased with the announcement. The chart below shows the S&P 500 since September 2008 and the yellow areas mark the beginning-end of the prior quantitative easing programs. Even though two QE cycles are not enough to establish a trend, notice that the stock market rallied during the prior two QE periods and fell sharply when they ended (red arrows). Of course, the S&P 500 was up substantially before these declines and ripe for a correction. More importantly, the index established a higher low after each decline and subsequently advanced to new highs. As the blue channel lines show, the trend is clear on this chart. Even though chartists can debate whether or not the index is overbought and ripe for a correction or pullback, there is no arguing the uptrend. Anything trading at a 52-week high is in an uptrend.
Click this image for a live chart.
The indicator window shows the Vortex Indicator, which is new at StockCharts.com. This indicator combines elements of the Average True Range (ATR), Plus Directional Movement (+DM), Minus Directional Movement (-DM) and the properties of a vortex flow. See the ChartSchool article for the all the gory details. This indicator consists of two lines: a green line to measure upward price movement and a red line to measure downward price movement. The bulls have the edge when the green line is above the red line. The bears have the edge when the red line is above the green line. As with all indicators, it is not immune to whipsaws and bad signals. The Vortex Indicator is helpful for trend identification because it is unambiguous. Either the green line is above the red line or it isn't.
Have a great weekend!
Arthur Hill CMT


