All the recent talk has centered around the effect of a potential fiscal cliff. While we may or may not be subject to a fiscal cliff, each and every one of us has been subject to the recent technical cliff, especially the one since election day. Things have gone from bad to worse in the past couple weeks. We did see a series of potential reversing candlesticks print on Friday across our major indices, sectors, industry groups and leading individual stocks, however. Will that be enough to turn the table on the bears? Or will this simply turn out to be a temporary halt to the selling before another leg lower?
Take a look at the hammer that printed on the NASDAQ on Friday:

Short-term, the Friday reversal appears to be good news. The daily MACDs that are sprinting lower carry a much more ominous sign, however, as they're screaming at us that the momentum remains firmly in the bearish camp and any short-term upside move will likely be just that - a short-term one.
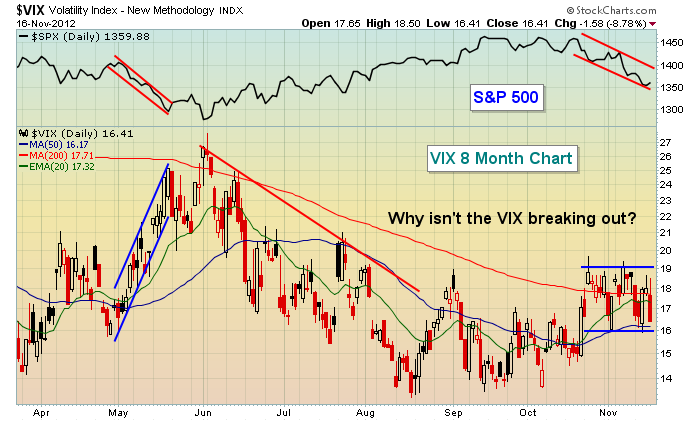
There was much talk last week that sentiment had turned decidedly negative and that was pushing our major indices lower. Ummmmm, I respectfully beg to differ. In fact, I'm not sure what to make of the Volatility Index (VIX), which generally moves inversely to the S&P 500. During market selloffs like the one we've seen lately, the VIX normally surges, reflecting the increased nervousness in the market. But since election day, while the S&P 500 fell more than 5% over six trading days, the VIX also fell - more than 10%! Check out the chart:

A lower VIX indicates the market is expecting lower volatility ahead. If you study history, you'll clearly see that a falling VIX is synonymous with a rising equity market. This begs two obvious questions. First, will the VIX surge near-term to play "catch up" with falling equity prices? Or is it telling us something about the duration of the wicked selling we've been experiencing - that it, in fact, won't last?
In the days and weeks ahead, we're going to learn more about both the fiscal cliff and the technical one. Please be cautious and keep your stops in place.
Happy Thanksgiving and happy trading!
Thomas J. Bowley
Chief Market Strategist
Invested Central
Take a look at the hammer that printed on the NASDAQ on Friday:

Short-term, the Friday reversal appears to be good news. The daily MACDs that are sprinting lower carry a much more ominous sign, however, as they're screaming at us that the momentum remains firmly in the bearish camp and any short-term upside move will likely be just that - a short-term one.
There was much talk last week that sentiment had turned decidedly negative and that was pushing our major indices lower. Ummmmm, I respectfully beg to differ. In fact, I'm not sure what to make of the Volatility Index (VIX), which generally moves inversely to the S&P 500. During market selloffs like the one we've seen lately, the VIX normally surges, reflecting the increased nervousness in the market. But since election day, while the S&P 500 fell more than 5% over six trading days, the VIX also fell - more than 10%! Check out the chart:

A lower VIX indicates the market is expecting lower volatility ahead. If you study history, you'll clearly see that a falling VIX is synonymous with a rising equity market. This begs two obvious questions. First, will the VIX surge near-term to play "catch up" with falling equity prices? Or is it telling us something about the duration of the wicked selling we've been experiencing - that it, in fact, won't last?
In the days and weeks ahead, we're going to learn more about both the fiscal cliff and the technical one. Please be cautious and keep your stops in place.
Happy Thanksgiving and happy trading!
Thomas J. Bowley
Chief Market Strategist
Invested Central

About the author:
Tom Bowley is the Chief Market Strategist of EarningsBeats.com, a company providing a research and educational platform for both investment professionals and individual investors. Tom writes a comprehensive Daily Market Report (DMR), providing guidance to EB.com members every day that the stock market is open. Tom has contributed technical expertise here at StockCharts.com since 2006 and has a fundamental background in public accounting as well, blending a unique skill set to approach the U.S. stock market.
Learn More


