To historians, this doesn't come as a surprise. Since 1987, the Russell 2000 has produced annualized returns during the month of December of 43.38%. April is the next best month for small caps with its annualized return of 21.84%, a very distant second. Over the past 25 years, the Russell 2000 has fallen during December only 3 times. In 2007, they fell 0.23%. In 2005, they fell 0.60%. The only poor December that small caps have experienced came in 2002 when they tumbled 5.72%. Certainly part of that decline resulted from the 8.80% climb a month earlier in November 2002. The point here is that history does tend to repeat itself in the stock market and December 2012 appears to be no different for small cap traders.
Consider the month-to-date gains thus far by index:
Dow Jones: +1.27%
S&P 500: +0.99%
NASDAQ: +0.36%
Russell 2000: +3.16%
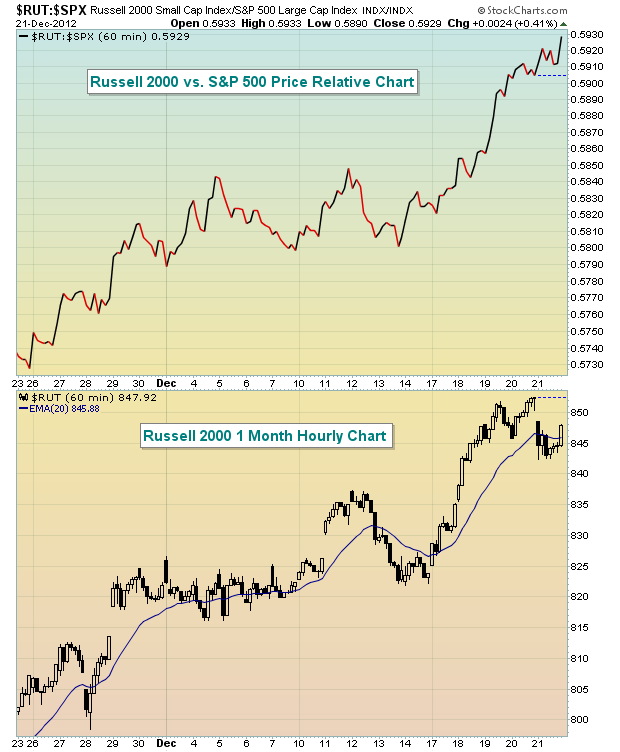
I'll admit that my background as a CPA qualifies me as a "numbers geek". So let's take a look at the December small cap relative outperformance another way - visually:

This chart shows us the strength (and the relative strength) of the Russell 2000 over the past month. But there's likely to be more relative strength in the days ahead. From December 21st through December 31st, the Russell 2000 has racked up annualized returns of 96.19% since 1987. The percentage of up days during this period is 69.36%, well ahead of the 55.40% chance of an up day throughout the year.
There's really no Santa Claus rally like the one we see on the Russell 2000 each year.
Happy Holidays and happy trading!
Consider the month-to-date gains thus far by index:
Dow Jones: +1.27%
S&P 500: +0.99%
NASDAQ: +0.36%
Russell 2000: +3.16%
I'll admit that my background as a CPA qualifies me as a "numbers geek". So let's take a look at the December small cap relative outperformance another way - visually:

This chart shows us the strength (and the relative strength) of the Russell 2000 over the past month. But there's likely to be more relative strength in the days ahead. From December 21st through December 31st, the Russell 2000 has racked up annualized returns of 96.19% since 1987. The percentage of up days during this period is 69.36%, well ahead of the 55.40% chance of an up day throughout the year.
There's really no Santa Claus rally like the one we see on the Russell 2000 each year.
Happy Holidays and happy trading!

About the author:
Tom Bowley is the Chief Market Strategist of EarningsBeats.com, a company providing a research and educational platform for both investment professionals and individual investors. Tom writes a comprehensive Daily Market Report (DMR), providing guidance to EB.com members every day that the stock market is open. Tom has contributed technical expertise here at StockCharts.com since 2006 and has a fundamental background in public accounting as well, blending a unique skill set to approach the U.S. stock market.
Learn More


