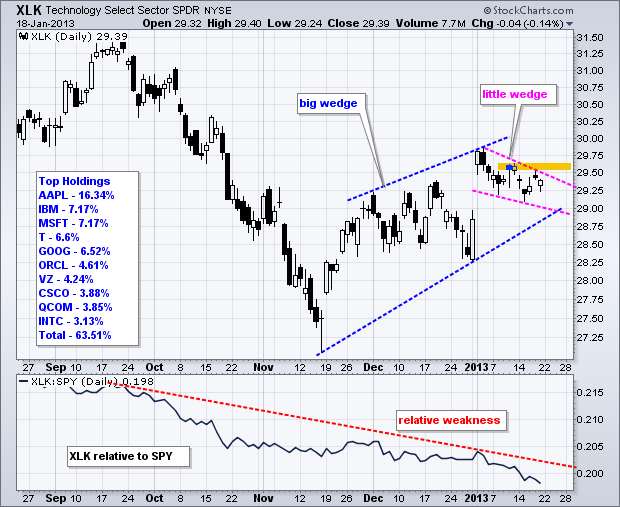
The Technology SPDR (XLK) has been lagging the broader market for some time now, but the trend since mid November remains up and a bullish continuation pattern is taking shape this month. Weighed down by its top components, XLK has been lagging the S&P 500 ETF since September. Relative weakness continued in January as the price relative fell further the last 2-3 weeks and recorded a 52-week low. Relative weakness in this key sector SPDR is negative, but the trend since mid November remains up. The blue trend lines show a rising wedge taking shape the last two months.
Click this image for a live chart
Even though rising wedges are potentially bearish, the wedge is currently rising and the trend is up as long as it rises. A break below the November trend line would provide the first sign of a medium-term trend reversal. Short-term, XLK formed a smaller falling wedge this month. Note that this pattern evolved after the 31-Dec surge and 2-Jan gap. Technically, this pattern looks like a bullish continuation pattern akin to a falling flag or pennant. A move above the orange resistance zone would reverse this fall and signal a continuation higher. Next week should tell the tale because IBM reports on Tuesday and Apple reports on Wednesday.
Good day and good trading!
Arthur Hill CMT


