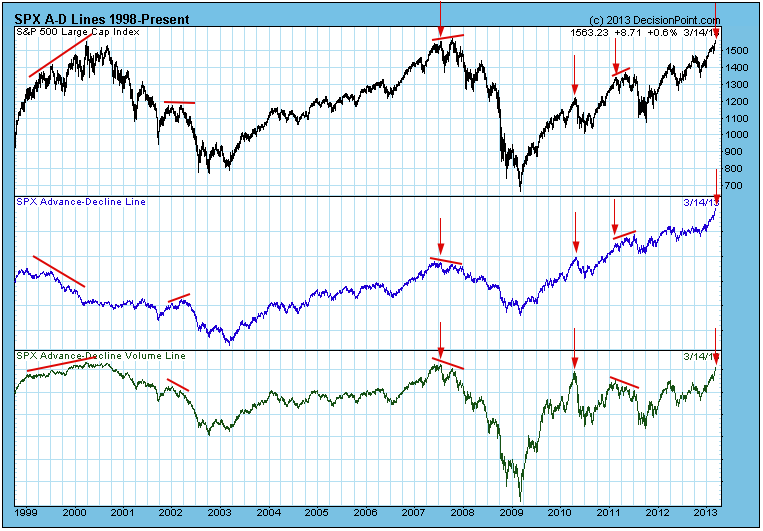
There are negative divergences on a lot of indicators we track (price makes a new high, but the indicators makes a lower high), but the advance-decline lines for breadth and volume are actually confirming the recent new price highs. This is reassuring but, it does not guarantee that even higher prices are coming.
First, I generally limit comparisons to periods of no more than about a year, because I don't think that comparisons over long periods are valid. For example, I am not concerned that the current volume level has not exceeded the 2007 volume top.
1999-2000: We had mixed signals. Breadth diverged negatively, while volume confirmed the price high.
2002: There was a reversal divergence on breadth and a negative divergence on volume - a thoroughly negative picture.
2007: There were negative divergences on both breadth and volume. Not a good outcome.
2011: A reversal divergence on breadth and a negative divergence on volume.
The down-pointing arrows identify some of the times where a new high was confirmed by one or both of the advance-decline indicators. In those instances the price top was followed immediately by a price decline, or the confirmed top was followed shortly by a slightly higher top, marking the high before a significant decline. (Note: There are many other confirmations that resulted in positive outcomes. I'm only trying to illustrate that this not always the case.)
Conclusion: Indicator divergences should always inject a note of caution into our outlook, and it is best when the indicators confirm new price highs, but a confirmation doesn't always mean that there is no immediate danger.


