In the last few weeks gold has experienced a major breakdown, and, of course, there are many opinions as to what will happen next. Let's take a broad look at the technicals, so that we have some context for making decisions.
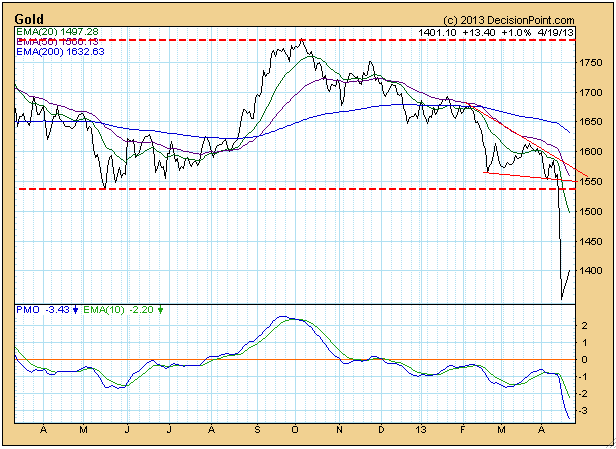
The daily chart shows the critical break below long-term support at about 1540. The bounce off the low is unlikely to be the beginning of a new rally, rather we think it is a short-term consolidation, like a reverse flag or pennant.
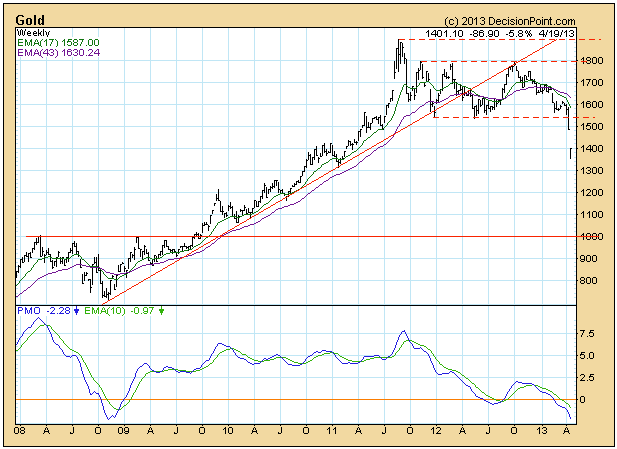
The weekly chart gives the best view of the trading range that has kept prices contained for over a year and a half. We thought that this was a price consolidation that would eventually lead to higher prices, so the failure of support was disappointing and has very negative long-term significance.
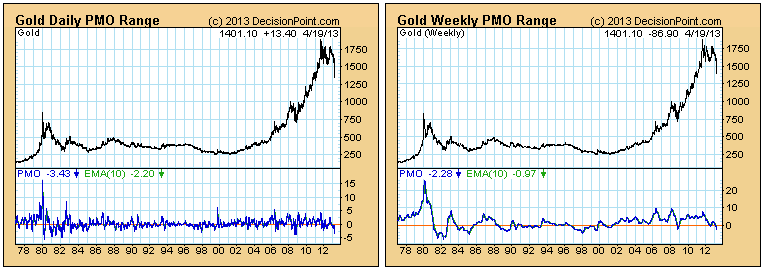
On the charts above you will notice that both the daily and weekly PMOs (Price Momentum Oscillators) are at the oversold side of the range shown on the charts, but a longer-term view below shows that neither PMO is challenging historical lows.
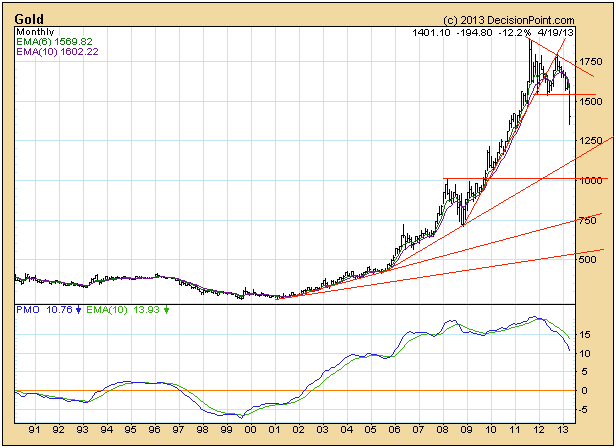
The monthly chart below gives the best perspective for gold's long-term prospects. While the top is broader than usual, we believe that we are seeing a collapsing parabolic. The "parabolic" is the gradually steepening curve as prices rose from the 2001 lows to the 2011 top. Typically, parabolics collapse back into their original basing range. For gold this range (based upon the price history visible on the weekly chart just above) is between about 250 and 500. I agree that doesn't sound reasonable, but it does fit normal expectations for a parabolic collapse.
In our opinion, the most obvious support level at this point is at about 1000. Support could easily be found higher than that, but for now let's stick with the obvious when estimating where a solid bottom could be found.
Conclusion: Long term, the trend for gold is down, and the condition, based upon the monthly PMO, is very overbought; therefore, we have to assume that outcomes will be negative until some improvement is seen.


