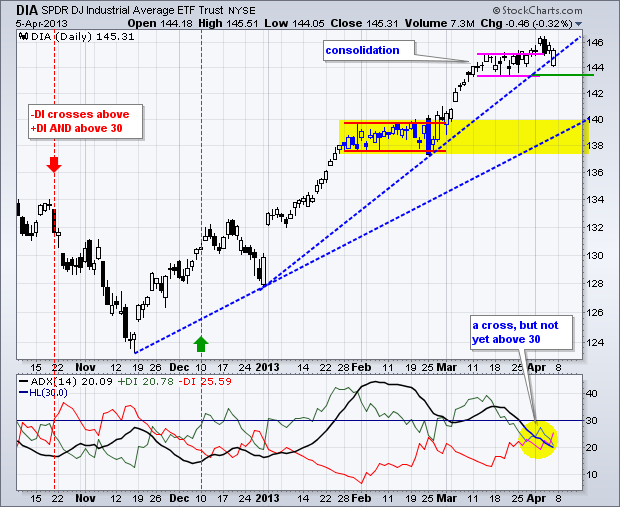
The Directional Movement Indicators have equalized as trading turns flat for the Dow SPDR (DIA), but the overall trend remains up as the ETF tests its first support zone. Let's look at support first. DIA hit 144 on March 11th and then traded flat the last few weeks with several crosses of this level. DIA dipped to 144.05 in early trading on Friday, but rallied after the weak open and closed above 145. Support in the 144 area extends from the mid March consolidation. A move below the consolidation lows would break support and argue for a deeper correction, perhaps to the 138-140 area.

Click this image for a live chart.
The indicator window shows the Average Directional Index (ADX) along with Plus Directional Movement (+DI) and Minus Directional Movement (-DI). +DI (green) crossed above –DI (red) on December 5th and exceeded +30 to kick off the current uptrend. I am using 30 to confirm crossovers and reduce whipsaws. Notice how +DI has moved above/below 30 since December, but –DI has yet to exceed this level. Most recently, the indicators converged in the low 20s as directional movement flattened and –DI crossed above +DI this week. Even so, the bulls still have the edge because +DI was the last one to exceed 30. –DI would have to break above 30 to confirm this crossover and reverse this edge. You can read more about these indicators in our ChartSchool.
Made in Manhattan!
--Arthur Hill CMT

About the author:
Arthur Hill, CMT, is the Chief Technical Strategist at TrendInvestorPro.com. Focusing predominantly on US equities and ETFs, his systematic approach of identifying trend, finding signals within the trend, and setting key price levels has made him an esteemed market technician. Arthur has written articles for numerous financial publications including Barrons and Stocks & Commodities Magazine. In addition to his Chartered Market Technician (CMT) designation, he holds an MBA from the Cass Business School at City University in London.
Learn More