The major stock indices recorded 52-week highs this week and these highs were confirmed by the breadth indicators for the S&P 1500. Note that the S&P 500, S&P MidCap 400, S&P SmallCap 600, Nasdaq 100 and Dow Industrials recorded fresh 52-week highs this week. When the major indices hit 52-week highs, I always check key breadth indicators for confirmation. Failure to confirm suggests that the stock market is not hitting on all cylinders. New highs in key breadth indicators, on the other hand, reflect broad underlying strength that validates the overall uptrend. I like to use the breadth indicators for the S&P 1500 because this is a broad index that covers large-caps, mid-caps, small-caps and Nasdaq stocks. Over 500 stocks in the S&P 1500 are traded on the Nasdaq.

Click this image for a live chart
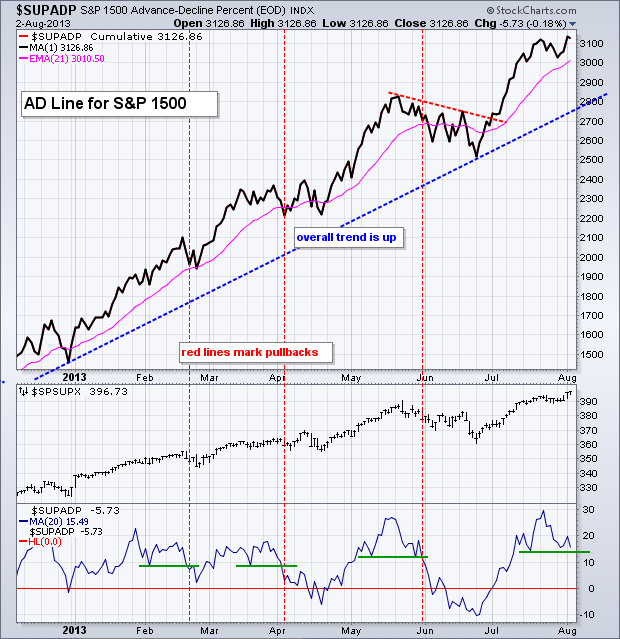
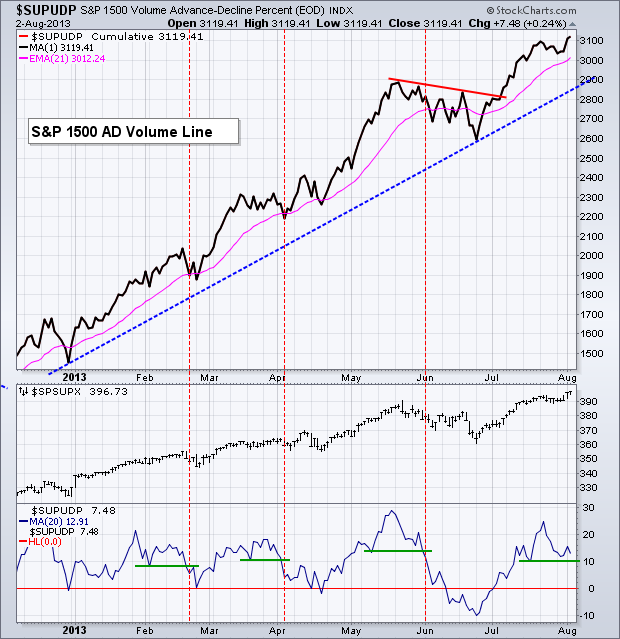
The chart above shows the S&P 1500 AD Line ($SUPADP) turning up this week and moving above the 23-July high. The overall trend is clearly up and breadth is keeping pace with the underlying index (S&P 1500). The indicator window shows the 20-day SMA of Net Advances for the S&P 1500. This moving average acts as like a momentum oscillator for short-term breadth. The green lines mark short-term support levels. Prior support breaks coincided with pullbacks in the S&P 1500. The first two were real short, while the third lasted a few weeks. Chartists can watch the current support line for breaks that may lead to a pullback in the stock market. The chart below shows the S&P 1500 AD Volume Line ($SUPUDP) with similar characteristics.

Click this image for a live chart

Click this image for a live chart
The chart above shows the S&P 1500 AD Line ($SUPADP) turning up this week and moving above the 23-July high. The overall trend is clearly up and breadth is keeping pace with the underlying index (S&P 1500). The indicator window shows the 20-day SMA of Net Advances for the S&P 1500. This moving average acts as like a momentum oscillator for short-term breadth. The green lines mark short-term support levels. Prior support breaks coincided with pullbacks in the S&P 1500. The first two were real short, while the third lasted a few weeks. Chartists can watch the current support line for breaks that may lead to a pullback in the stock market. The chart below shows the S&P 1500 AD Volume Line ($SUPUDP) with similar characteristics.

Click this image for a live chart

About the author:
Arthur Hill, CMT, is the Chief Technical Strategist at TrendInvestorPro.com. Focusing predominantly on US equities and ETFs, his systematic approach of identifying trend, finding signals within the trend, and setting key price levels has made him an esteemed market technician. Arthur has written articles for numerous financial publications including Barrons and Stocks & Commodities Magazine. In addition to his Chartered Market Technician (CMT) designation, he holds an MBA from the Cass Business School at City University in London.
Learn More


