ChartWatchers

U.S. Dollar Index Falls to Two-Year Low

John Murphy

John Murphy

Chief Technical Analyst, StockCharts.com

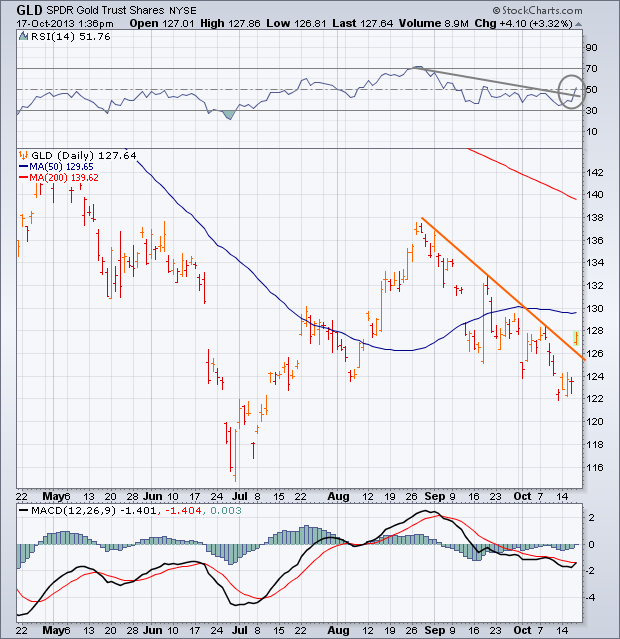
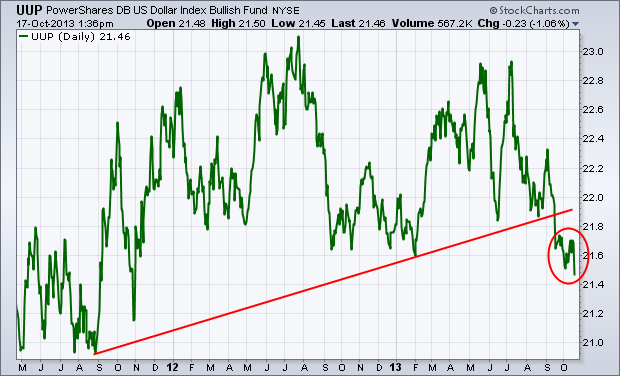
The U.S. dollar continues to weaken. Chart 1 shows the PowerShares US Dollar Bullish Fund (UUP) falling to the lowest level since the third quarter of 2011. One of the side-effects of a falling dollar is that it gives a boost to gold. And it's doing just that. Chart 2 shows the SPDR Gold Trust (GLD) gapping 3% higher today. In so doing, it is rising above a falling trendline drawn drawn over its August/September peaks. The 14-day RSI line (top of chart) is about to rise above 50 for the first time in two months. And the daily MACD lines (bottom of chart) appear poised to turn positive for the first time since August. Gold stocks are also rallying today along with other stocks tied to commodity prices.

20131017001-sc

20131017002-sc

John Murphy
About the author: is the Chief Technical Analyst at StockCharts.com, a renowned author in the investment field and a former technical analyst for CNBC, and is considered the father of inter-market technical analysis. With over 40 years of market experience, he is the author of numerous popular works including “Technical Analysis of the Financial Markets” and “Trading with Intermarket Analysis”. Before joining StockCharts, John was the technical analyst for CNBC-TV for seven years on the popular show Tech Talk, and has authored three best-selling books on the subject: Technical Analysis of the Financial Markets, Trading with Intermarket Analysis and The Visual Investor. Learn More