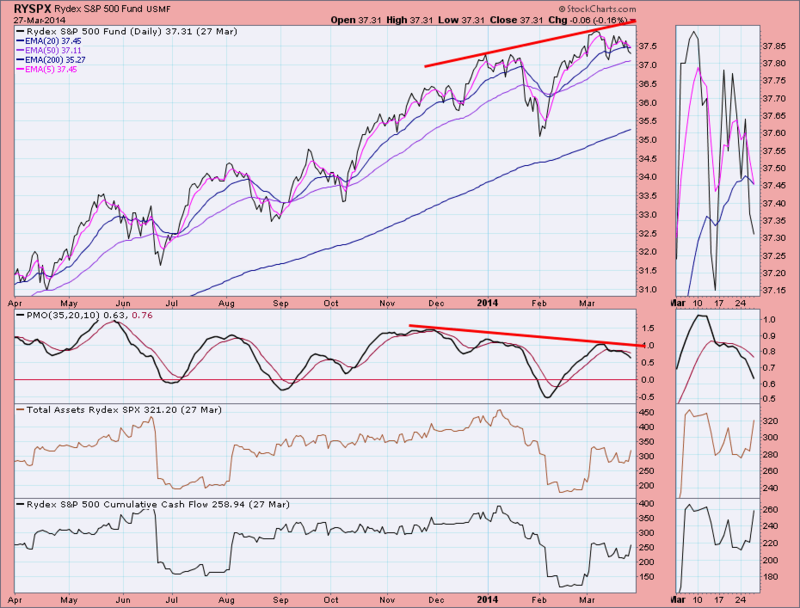
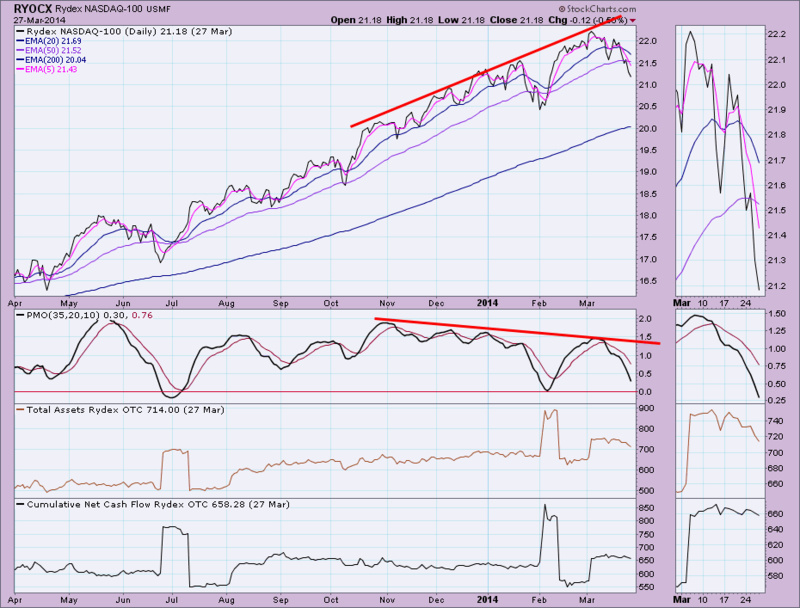
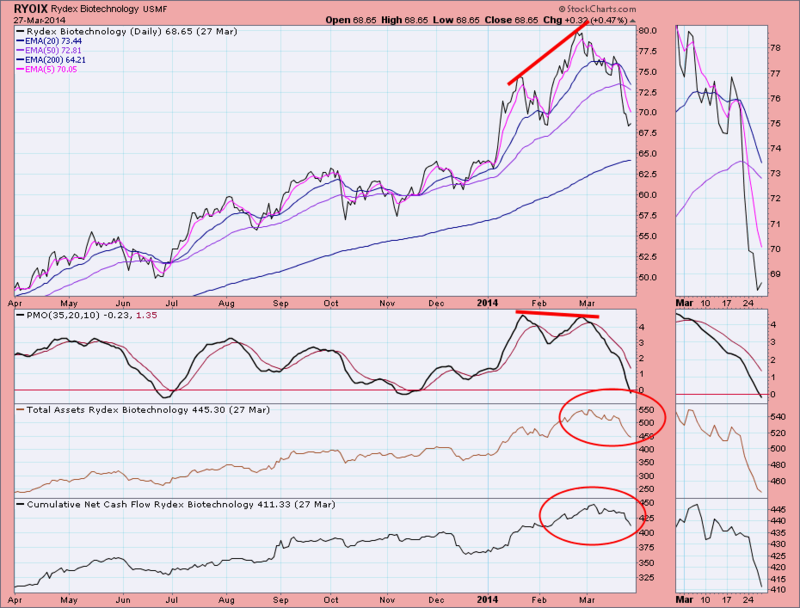
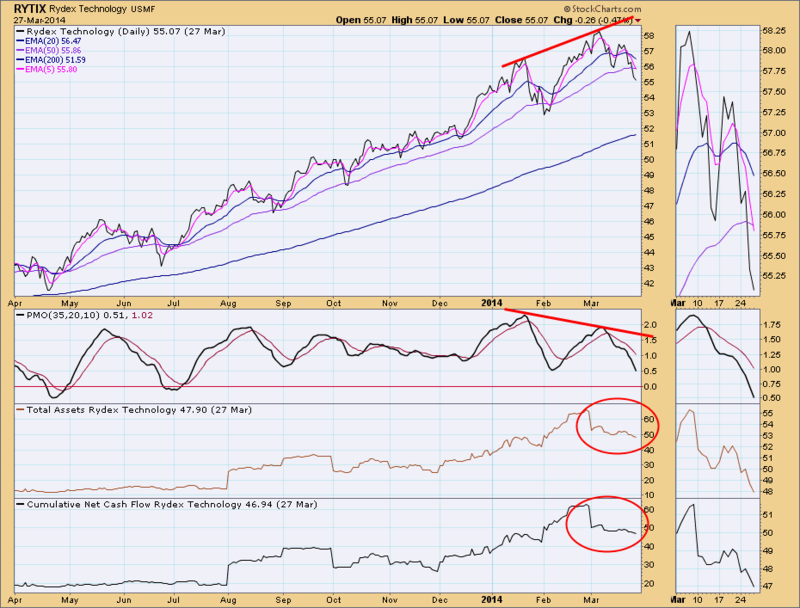
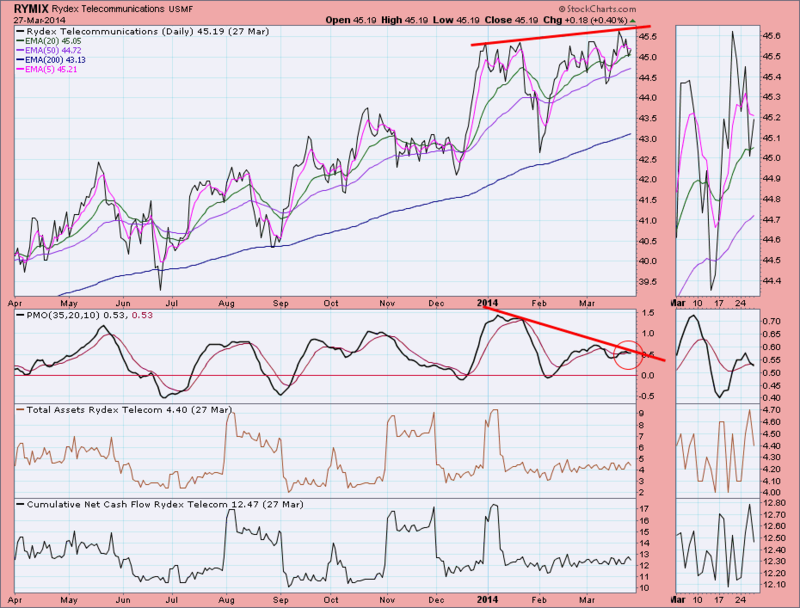
I noticed a number of PMO negative divergences appearing on the Rydex Funds while clicking through the assets and cashflow charts in the DecisionPoint Rydex ChartPack. Not only are there negative divergences, many of these funds are still showing a large amount of assets and cashflow into them.
Take a look at the following:
You can see how these divergences led to declines once the selling began, Biotechnology is an excellent example. Cashflow into the funds is tailing off, but assets remain high.
In the case of Telecommunications, the divergence is just occurring and we see that the PMO just had a negative crossover. The decline has begun, but given the falling PMO, the neutral cashflow and PMO crossover sell signal, there could be more. I would have more skeptism regarding this PMO crossover as it comes right after a previous one, but the negative divergence gives more confidence in the alert.
The DecisionPoint Price Momentum Oscillator (PMO) can be used in the shorter term by looking at direction shifts, rising or falling. In the medium-term, positive and negative crossovers can flag possible entry points. To confirm these PMO crossover alerts, we can look at PMO positive and negative divergences.
Happy Charting!
Erin

