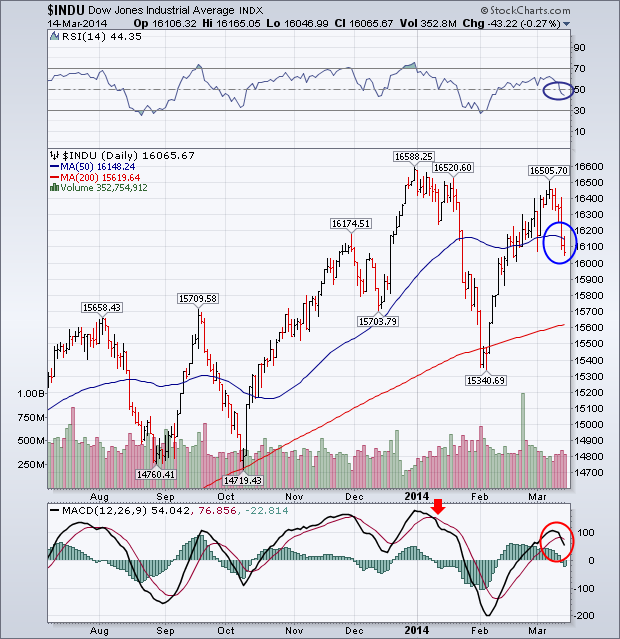
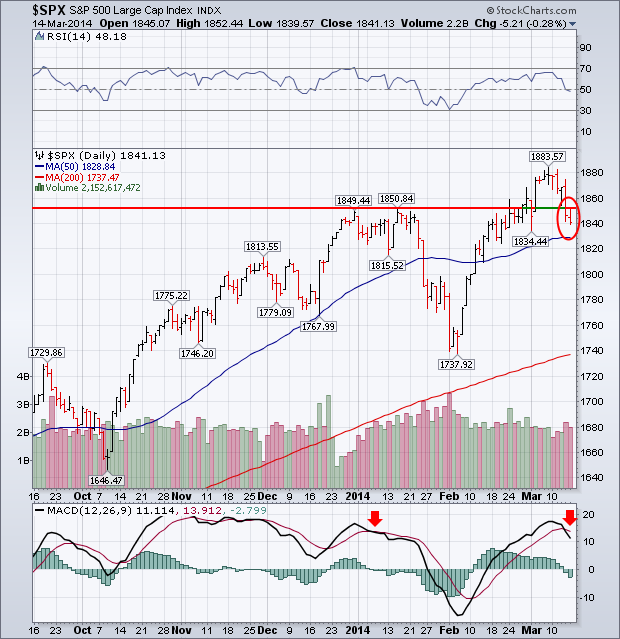
My Wednesday message warned that the Dow Industrials could run into profit-taking near its January highs, and that weekly indicators for the S&P 500 were giving "negative divergences" which also warned of a market pullback. Combined with increased tensions in the Ukraine and increased concerns about problems in the Chinese economy, it was no surprise then to see the markets fall sharply later in the week. And some short-term technical damage was done. Chart 1 shows the Dow Industrials falling below its 50-day average (on rising volume). At the same time, the 14-day RSI line (above chart) slipped below 50. More importantly, daily MACD lines (below chart) turned negative for the first time since early January. I wouldn't be surprised to see the Dow retest its 200-day average and/or its February low. Chart 2 shows the S&P 500 falling back below its January high (also on higher volume) and threatening its 50-day line. Daily MACD lines turned down as well. [As shown on Wednesday, weekly S&P 500 MACD lines have been negative since January which makes this week's downturn potentially more serious].


