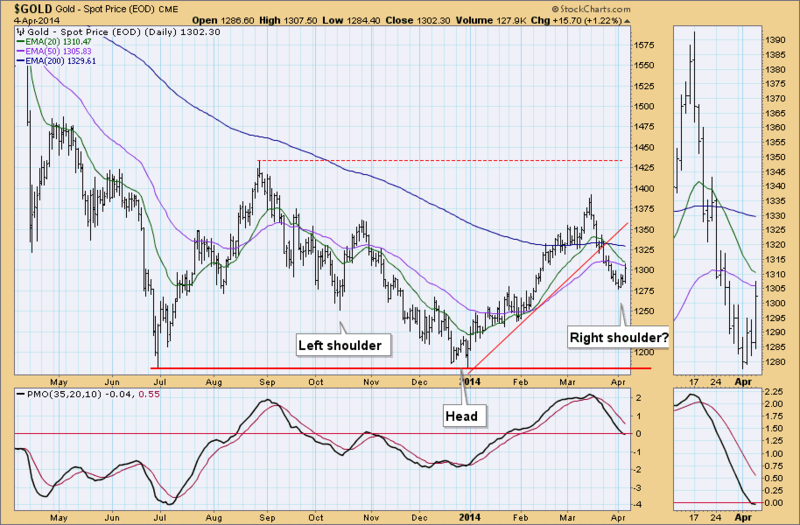
While I was reviewing the Gold daily 1-year chart, I noticed after Friday's close that we could be looking at a bullish reverse head and shoulders pattern forming up. I've annotated what I view as a left shoulder and head along with where we would look for a right shoulder.
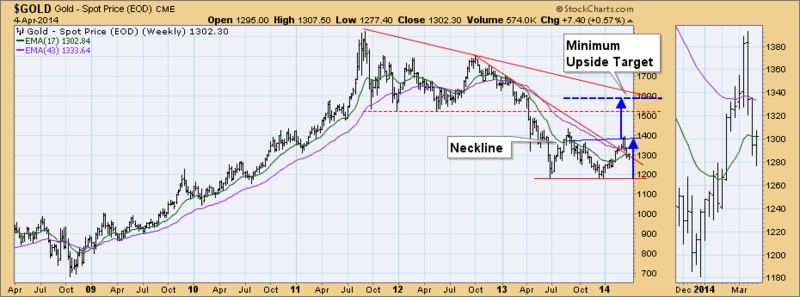
As most of you know, this is a bullish pattern. I don't want to get to far ahead of myself, but here's how it would play out if the right shoulder comes to be. Once price has risen to form the right shoulder, price would then need to break through the neckline. I've annotated the neckline in the weekly chart below.
If price penetrates that neckline, the expectation is for price to proceed higher to a minimum upside target that measures the length from the top of the head to the neckline. Interestingly that it would put price right around resistance that is already in place on the weekly chart.
Again, this is VERY early in the formation, so my hypothesis is based on whether first, the formation actually comes together and second, that the neckline will be penetrated. Just thought you'd be interested in seeing the possibilities with me!
Happy Charting,
Erin


