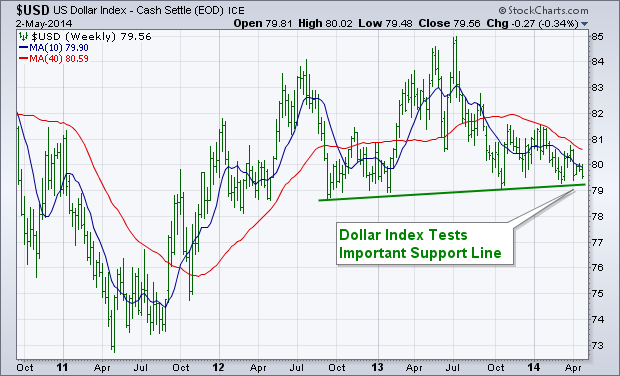
The dollar has been weakening since the start of the year, and is now in the process of testing some important chart support. The weekly bars in the chart below show the U.S. Dollar Index ($USD) testing a support line drawn under 2012-2013 lows. A decisive close below that trendline would represent a technical breakdown in the greenback. There would be at least two possible side effects if that were to happen. One would be a boost in commodity prices (like gold) which generally rise when the dollar falls. Another potential side effect of a weaker dollar is that it favors foreign stocks over U.S. stocks. That's even more true of foreign markets that produce commodities -- like Brazil and Canada. We may already be seeing that happen.
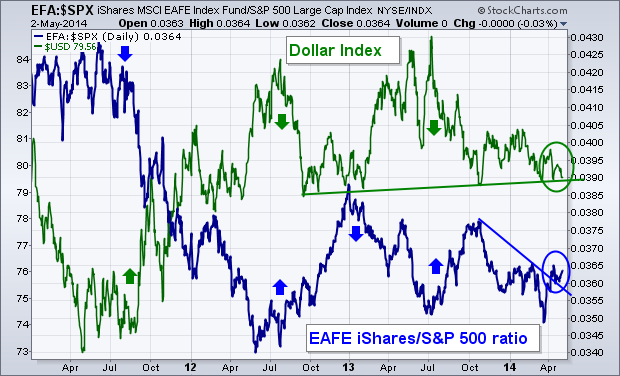
FALLING DOLLAR BOOSTS FOREIGN STOCK PERFORMANCE... The next chart compares the Dollar Index to a "ratio" of EAFE iShares divided by the S&P 500 (blue line). The ratio shows how foreign developed markets in Europe Australasia and the Far East are doing "relative" to the U.S. market. The chart shows that the two lines generally trend in opposite directions. Upturns in the U.S. dollar in the summer of 2011 and the start of 2013 coincided with weaker foreign performance (falling ratio). Dollar peaks in the summers of 2012 and 2013 strengthened foreign performance (rising ratio). The EAFE/SPX ratio has jumped over the last month as the dollar has weakened (see circles). Given that historic relationship, any serious dollar breakdown from here would give a boost to foreign currencies and foreign stock performance along with them.
CHARTCON 2014... I'm looking forward to seeing everyone in Seattle in August at ChartCon 2014. Click here if you'd like to join us.
- John


