As a student of stock market history, I'm often astonished by historical facts about market performance. December is generally a very solid month for equities and no index benefits more from this seasonal bullishness than the Russell 2000. Since 1987, the Russell 2000 has risen 24 of 27 years during the month of December, sporting a robust 42.45% annualized return. It is BY FAR the best month of the year for small caps with the second best month - April - lagging way behind with an annualized return of 19.42%.
Of the 3 negative Decembers on the Russell 2000, there was a 0.23% loss in 2007, a 0.60% loss in 2005 and a 5.72% loss in 2002. So really the 2002 year was the only year since 1987 where small caps have performed very poorly. That's 1 bad year out of 27. Small caps gained ground in December every year from 1987 through 2001. Being overly bearish small caps during December has proven to be a very poor trading strategy. So does this mean we should be ALL IN on the long side? Of course not. First of all, history is just that - history. It provides us no guarantees about future performance. But even beyond that limitation, one third of December actually is quite bearish for small caps. This may be the most amazing historical statistic of all.
For purposes of historical market performance, December can be broken down into three periods as follows:
1st through 6th
7th through 15th
16th through 31st
The performance between these these periods is staggering. Take a look at the annualized returns by period:
1st through 6th: +25.81% (up 20 times, down 7 times)
7th through 15th: -22.77% (up 5 times, down 22 times)
16th through 31st: +78.84% (up 24 times, down 3 times)
A couple more historical facts:
Remember, it was pointed out above that the Russell 2000 moved higher every year from 1987 to 2001, or 15 consecutive years. Well, consider that this same index LOST value every year from 1988 to 2003, (or 16 consecutive years!) during the December 7th through the 15th period. That is quite remarkable.
So why bring this up? Well, check your calendar because the December 7th through 15th period starts on Monday. This would be the time where we begin to see some selling, if it's going to happen in December. Here's the current technical look at the Russell 2000 as this potentially bearish period begins:
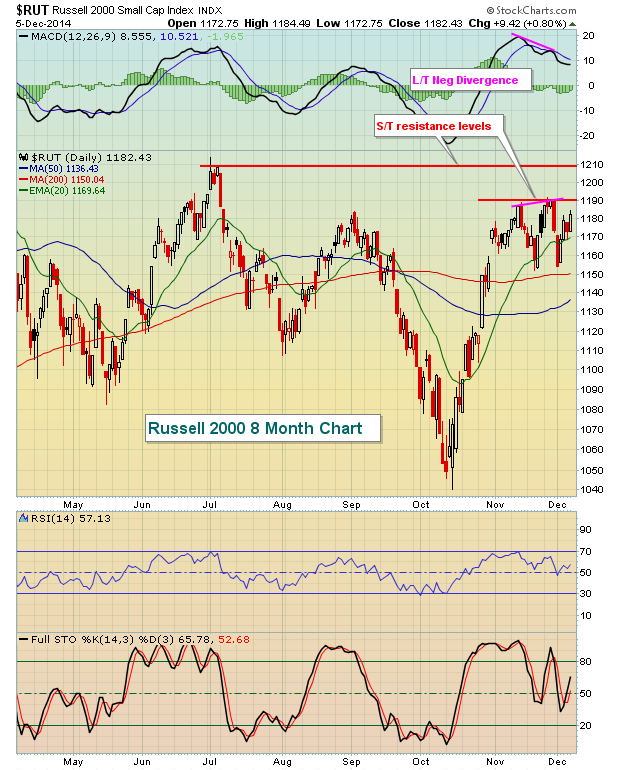
There is a long-term negative divergence still in play and a couple of key price resistance levels overhead that must be negotiated. So if the bulls are going to take charge next week, they're going to have their work cut out for them.
Over the next week to ten days, it makes sense to look for small cap stocks that have been performing well, but poised for some short-term selling. One such stock is Tessera Technologies (TSRA), part of the very hot semiconductor industry. It's beginning to show a weakening daily MACD along with an extremely overbought RSI at 80. If it sells off in the week ahead, it could become a much better reward to risk trading candidate on the long side as we wrap up 2014.
I'm featuring another small cap stock stock for my Monday Chart of the Day. This Chart of the Day is free and I'm also having a webinar this Wednesday that discusses how I scan for and analyze stocks before including them as Charts of the Day. To register, simply CLICK HERE
Happy trading!
Tom Bowley
Chief Market Strategist
Invested Central


