With the market bottoming and taking a positive turn, I decided it might be a good time to review the results of one of my favorite and nicely discriminating short-term scans. It looks for stocks that are in a positive configuration of the 50/200-EMAs; meaning 50-EMA > 200-EMA which we consider the stock is in a "bull market". Then it looks for stocks with a new 5-EMA cross above the 20-EMA which is a short-term BUY signal. Finally, I whittle it down further by looking for stocks that have a Price Momentum Oscillator (PMO) that has been rising for three days and are approaching a positive crossover. This short-term scan is below:
[type = stock]
AND [Daily SMA(20,Daily Volume) > 50000]
AND [country = US]
AND [today's PMO Line(35,20,10) < today's PMO Signal(35,20,10)]
AND [today's PMO Line(35,20,10) > yesterday's PMO Line(35,20,10)]
AND [yesterday's PMO Line(35,20,10) > 2 days ago PMO Line(35,20,10)]
AND [2 days ago PMO Line(35,20,10) > 3 days ago PMO Line(35,20,10)]
AND [today's ema(50,close) > today's ema(200,close)]
AND [today's ema(5,close) > today's ema(20,close)]
AND [yesterday's ema(5,close) < yesterday's ema(20,close)]
This scan produced about 40 stocks. The first thing I do, is look at the results in "CandleGlance". Here is an excerpt of my screen.
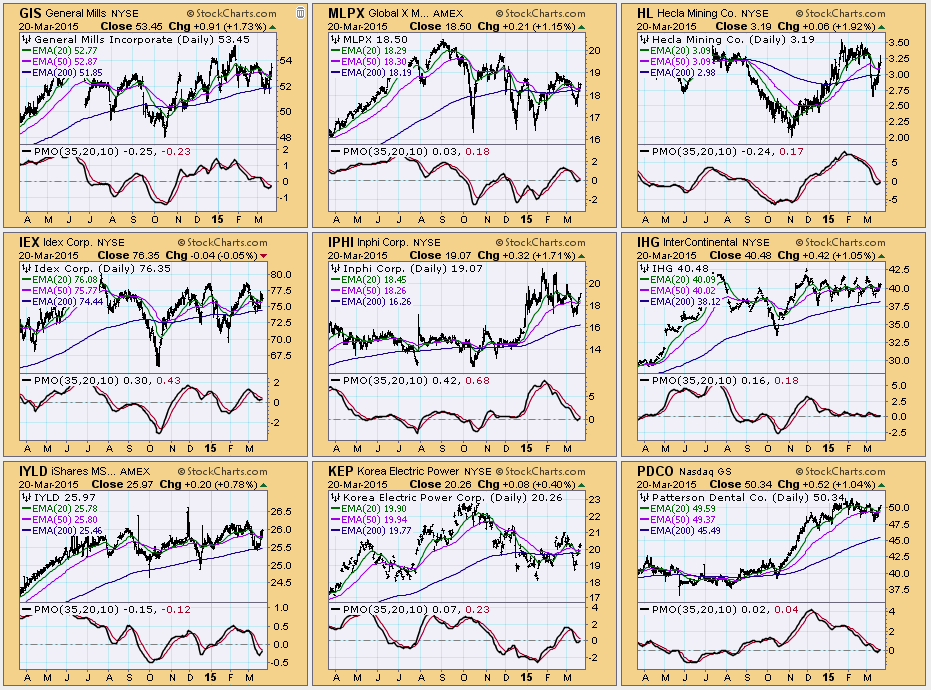
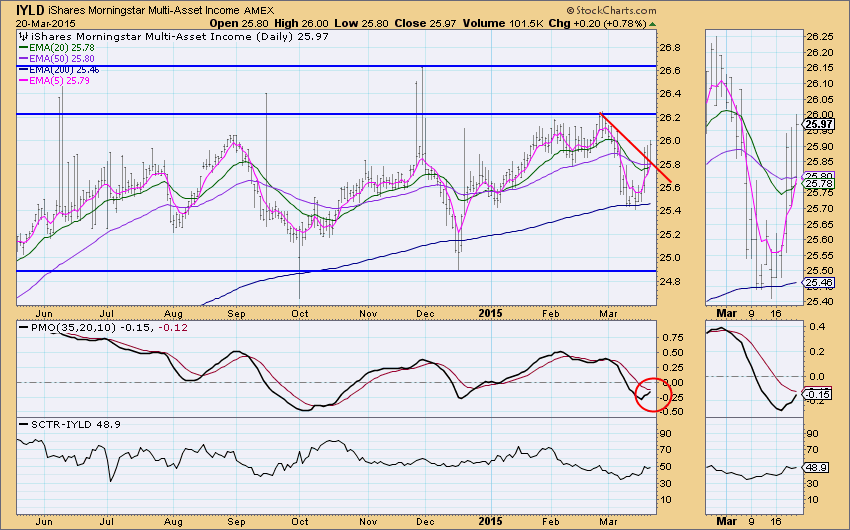
Looking at just the results above, there were two that looked interesting right out of the gate for me. IYLD, Morning Star Multi-Asset Income ETF is the first. I clicked on the chart and IYLD came up in the charting workbench with my default ChartStyle that doesn't include the 5-EMA. Since my scan included the 5-EMA, I switched my ChartStyle to my 5-EMA approach so I could see the 5/20-EMA crossovers. As part of this ChartStyle, the price bars are no longer opaque.
The IYLD chart looks promising. The PMO is approaching a positive crossover near the previous two bottoms, so this would be considered a crossover in somewhat oversold territory. Price broke out of a declining trend and the 20-EMA is approaching a positive crossover the 50-EMA which would generate an Intermediate-Term Trend Model BUY signal. The detractors on this chart are that near-term resistance is very close and the SCTR value is below 50. My normal threshold for the SCTR is above 70.
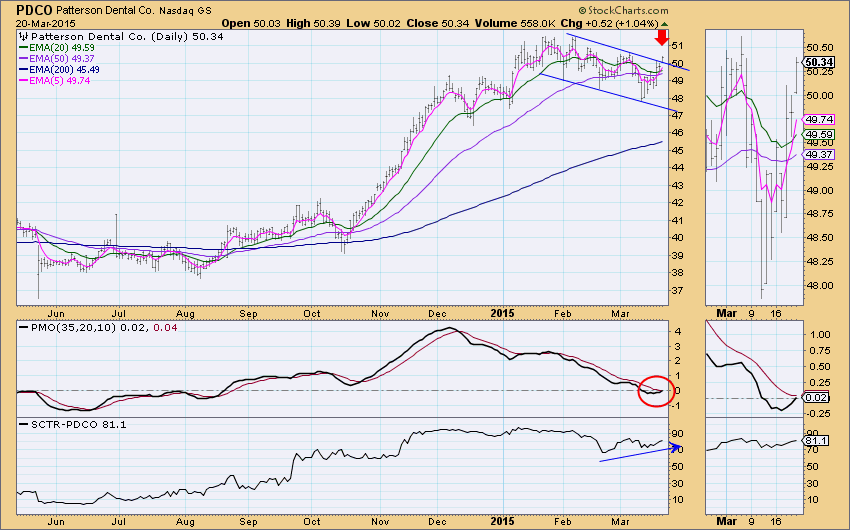
The second chart that caught my eye was PDCO, Patterson Dental Company. I like this chart better. Price has just broken out of a declining trend channel, the 5-EMA crossed the 20-EMA while the 20-EMA was above the 50-EMA which makes this Short-Term Trend Model BUY signal more bullish. The PMO is nearing a positive crossover BUY signal and the SCTR value has been rising. What are the problems? The all-time high was hit last January and that will be a strong area of resistance which is unfortunately, not that far away. This would be a short-term investment that I would have to watch closely.
Looking at the CandleGlance of all 40 of the scan results I found a few other charts of interest. Run the scan yourself and see if you can pick out the promising charts. Join Carl and I at the DecisionPoint LIVE! Webinar and watch real-time analysis of more charts. To ensure that you see your chart requests, tweet the symbols @_DecisionPoint.
Happy Charting!
Erin


