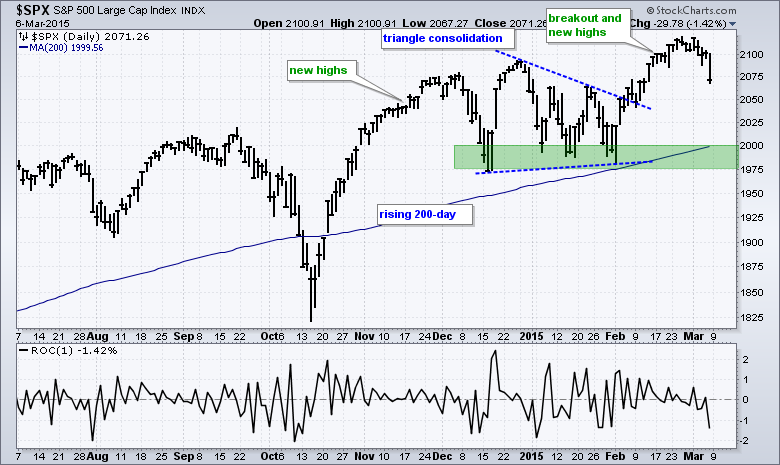
Stocks came under selling pressure in early March and this selling pressure intensified on Friday as the S&P 500 lost 1.42%, which was the biggest one day decline since late January. Even so, it is just one week of selling pressure and not enough to affect the long-term uptrend. As the chart below shows, the S&P 500 hit new highs in November-December, consolidated with a triangle into January and broke out in February. As far as the trend is concerned, the new highs affirm the long-term uptrend and I do not see a major topping pattern taking shape. The index is well above the rising 200-day moving average and the winter lows mark key support in the 1975-2000 area.
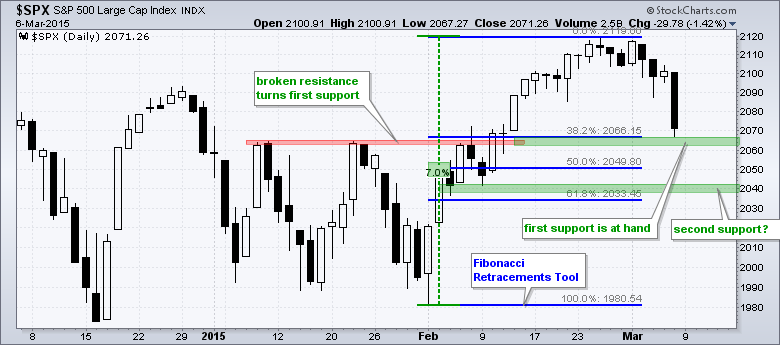
As far as the short-term is concerned, the index surged some 7% from low to high and a pullback is perfectly normal after a sharp advance. In addition, notice that the index is nearing its first support zone. A key tenet of technical analysis is that broken resistance turns support. The January highs marked resistance in the 2065 area and this area now becomes support. The blue lines show the Fibonacci Retracements Tool extending up from the February low to the February high. The 38.2% retracement is at 2066 and this is the first retracement level to watch for a short-term bounce or reversal. It is certainly possible that this short-term decline extends, but I would expect a reversal above the January lows. If the 2065 level does not hold, then I would look for a bounce around 2040, which is closer to the 61.8% retracement.
Thanks for reading and have a great weekend!
Arthur Hill CMT


