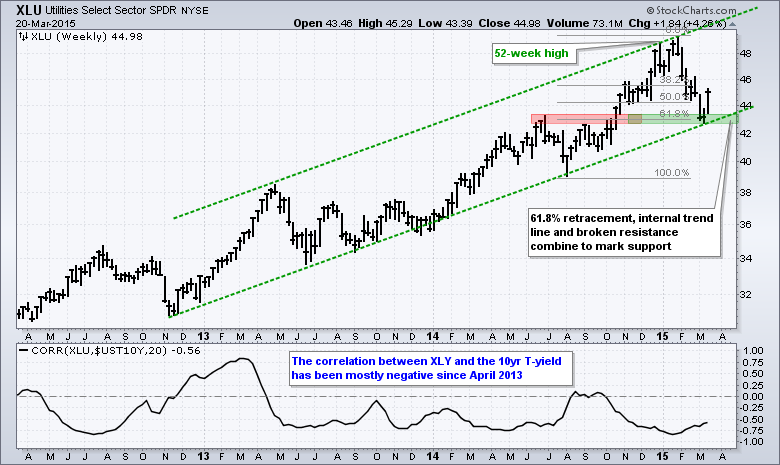
It was a big week for Treasury bonds, the 10-YR Treasury Yield and the Utilities SPDR. XLU fell sharply as yields surged in February, but rebounded this week as Treasury yields fell. Overall, the big trend for XLU appears to be up with a series of higher highs and higher lows since November 2013. The green dotted lines mark a rising price channel and the ETF hit a 52-week high less than two months ago. It also appears that a higher low is taking shape because XLY is reversing well above the August 2014 low. Notice that broken resistance, the 62% retracement and November 2012 trend line converge to mark support in the 43-44 area.
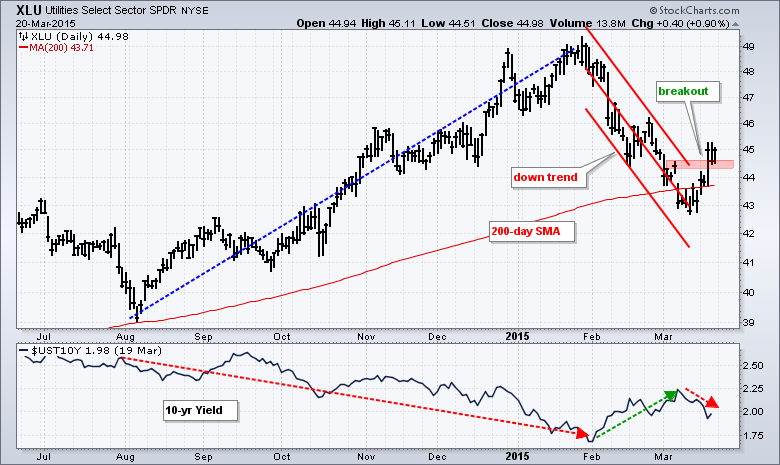
In addition to a support bounce on the weekly chart, XLU broke out this week on the daily chart. The second chart shows the Raff Regression Channel and early March high marking resistance at 45. Also notice that the rising 200-day moving average marks support in the 43-44 area. The ETF surged above the upper line of the Raff Regression Channel and above the early March high to reverse the eight week downtrend. The reversal on the daily chart suggests a continuation of the long-term uptrend on the weekly chart.
Thanks for reading and have a great weekend!
Arthur Hill CMT


