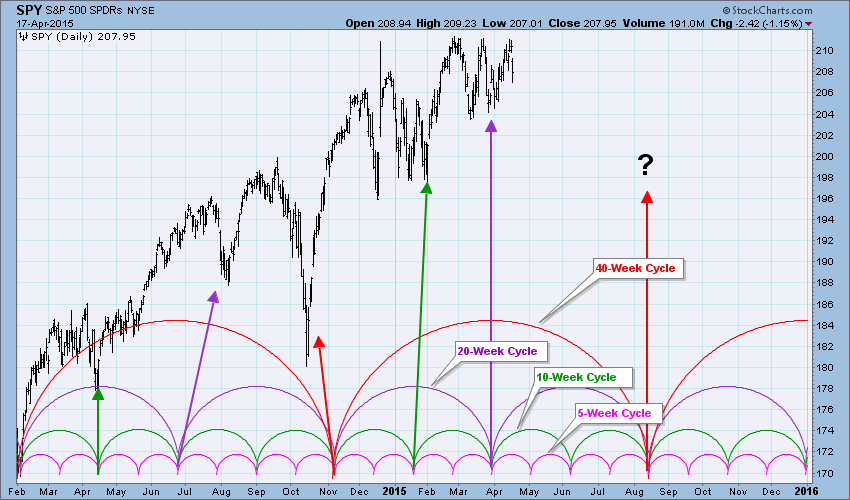
Carl presented his chart that illustrates typical market cycles at our DecisionPoint LIVE! Webinar last Wednesday (Here is a link to that broadcast). (P.S. Don't miss the next episode! Watch for the link on the homepage this week under "What's New"') As Carl said during the webinar, I should have a picture of him to accompany this chart with his hands thrown up in the air, eyes watering and his tousled hair sticking straight out from pulling on it while attempting to create the chart!
Cycle analysis like technical analysis is an art, far from a science. Nailing these cycles down today is especially difficult. Market cycles represent the ebb and flow of market action and seasonality. While this was difficult enough in the past, now it requires even more creativity given the meddling of the Federal Open Market Committee (FOMC) with their interest rate suppression and bond buying activities of Quantitative Easing.
An easy to read example of a long-term cycle is in the monthly chart below where you can see the shape and clarity of previous bull and bear market cycles of the last 20 years. Yet, with the help of the FOMC we can see that a bear market has been avoided and price broke out of the cycle pattern.
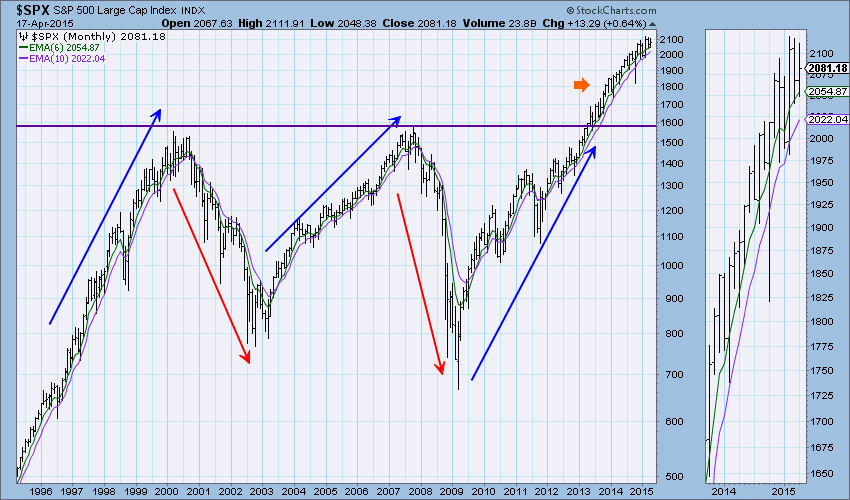
This is only an example, as many of us know that before 1997 there were factors that muddied the water and disrupted the flow then too.
Below is the cycle chart that Carl created (and I added a few annotations to). The areas where all of the cycle lows intersect are of great interest since a cycle low is due for all. The last time this happened was in October 2014 and while it came in late, it was still pretty close. The next time this happens is in August.
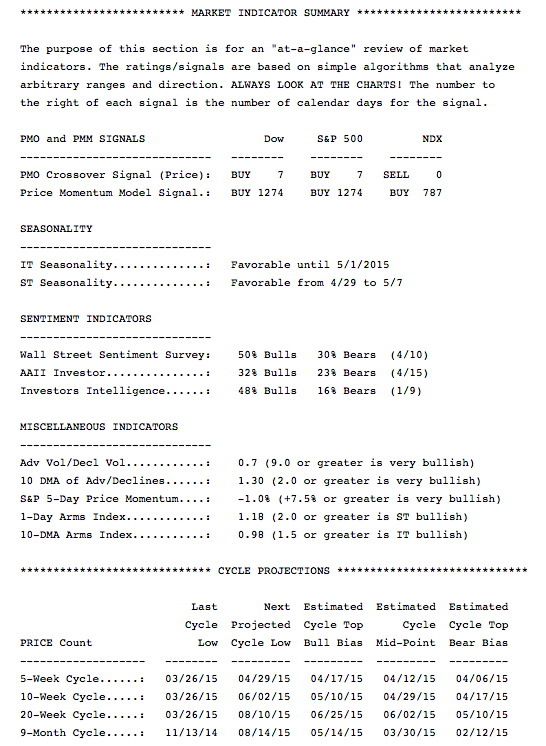
Studying cycles can be frustrating. It is one of those technical tools that is easier to see and "fit" after the fact. You will find the table of our seasonality and cycle dates in the DP Alert Daily Report found in the member DP Reports blog. Here is an excerpt:
Happy Charting (or hair pulling)!
Erin
