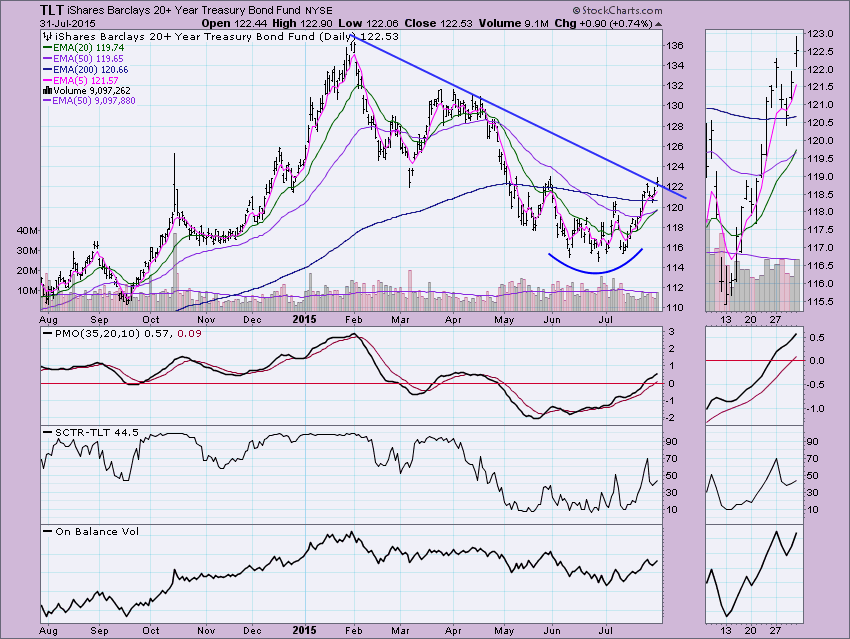
With the new Intermediate-Term Trend Model (ITTM) BUY signal on TLT and the breakout for the second time above the March low, I decided it was definitely time to abort the bearish Adam and Eve double-top pattern that I have been watching in earnest. Instead, I'm now seeing a rounded bottom; also known as a saucer bottom; it is a reversal chart pattern representing a long period of consolidation that turns from a bearish bias to a bullish bias (ChartSchool article on Rounded Bottoms located here). The Price Momentum Oscillator (PMO) has also been making a case to move bullish on TLT; it has continued to rise and is now in positive territory. The SCTR value is rising again and the On Balance Volume (OBV) shows that volume is behind this move (thumbnail shows that best). The recent Long-Term Trend Model (LTTM) SELL signal suggested the double-top would execute, but now it appears that signal is in jeopardy as the 50-EMA reaches out to crossover the 200-EMA.
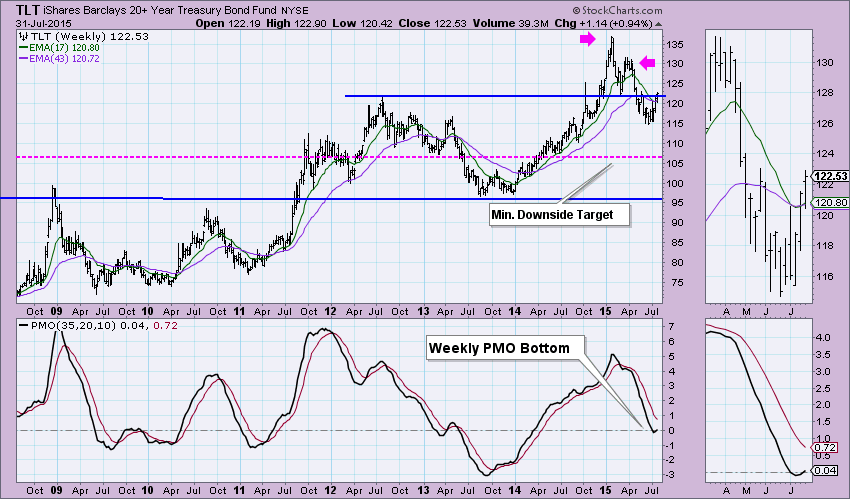
You can see the major double-top formation on the weekly chart, but we can also see that price has broken above the neckline which technically nullifies the pattern. The 17-EMA had a positive crossover the 43-EMA this week. The PMO bottomed which is always bullish. Had the double-top pattern fully executed, the minimum downside target was around $107.50. That could hold up as an area of support should price reverse, but at this point, I'm not looking for a serious decline. Price has only just popped above resistance, so a major decline could reintroduce the double-top pattern, but I believe the rounded bottom is going to override that possibility.
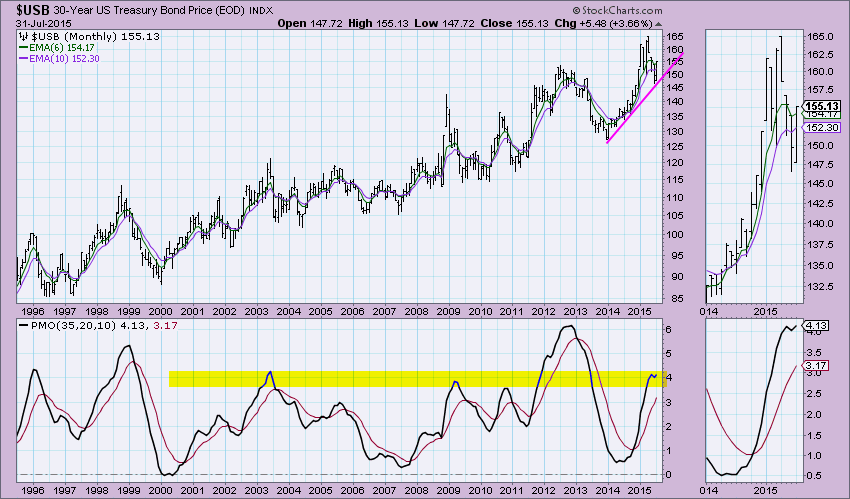
The monthly PMO on the 30-Year Bond was ready to top in shorter-term overbought territory, but instead it turned up. It hasn't reached overbought extremes, so it could certainly back a longer rally.
Conclusion: While the Adam and Eve double-top is still visible, the new rounded bottom pattern and the upside break above the neckline supersedes the bearish implications. A bearish outcome is possible as price has just barely closed above the old double-top neckline, but indicators and EMAs suggest otherwise.
Technical Analysis is a windsock, not a crystal ball.
Happy Charting!
- Erin


