 If you've ever practiced archery, you know that your ultimate objective is to put the arrow in the bulls-eye, but just putting it on the target still feels pretty good. While we aim at perfection, we'll happily settle for competence. If you are good enough to stay on the target, you'll score some points, and the odds are good that you'll even hit some bulls-eyes.
When I was just beginning my studies in technical analysis, a friend and I were working independently to develop a magic bullet for investing. I had come up with an indicator that I believed predicted the direction and duration of market moves. At one time the indicator predicted an up move of several weeks, so on paper I picked 25 stocks to go long (out of the over 100 stocks we were charting by hand, by hand mind you!). After a few weeks, 23 of the 25 stocks I had chosen were winners. My friend in exasperation asked, "How did you do that?!" Of course, I thought I knew the answer.
Ultimately, I learned that my magic indicator didn't really predict market movement after all. But a valuable lesson I did learn was that, if you invest with the direction of the market, you will greatly improve your odds of winning, even if you are picking stocks by throwing darts at the stock listings in the newspaper. No, I don't encourage such foolishness, but I do encourage you to find a method of determining where to market is likely headed, and another method for choosing stocks that have a good chance of exploiting the market tide.
At this point I would be derelict in my duty if I didn't mention the DecisionPoint Alert Daily Report, available to StockCharts.com Basic subscribers. In that report we present tools, evidence, and interpretation thereof, to help determine market direction. Our motto: "Technical analysis is a windsock, not a crystal ball." We look to see in which direction the windsock is pointing, as well as try to determine if there are storms in the vicinity that might cause the wind direction to change.
As for the current market direction, I didn't think it was an ideal time to go long. The Trend Model was on a Neutral signal, and my opinion was (and is) that the market is topping. But our Long-Term Trend Model is still on a BUY, so for the sake of the game, I decided to go long.
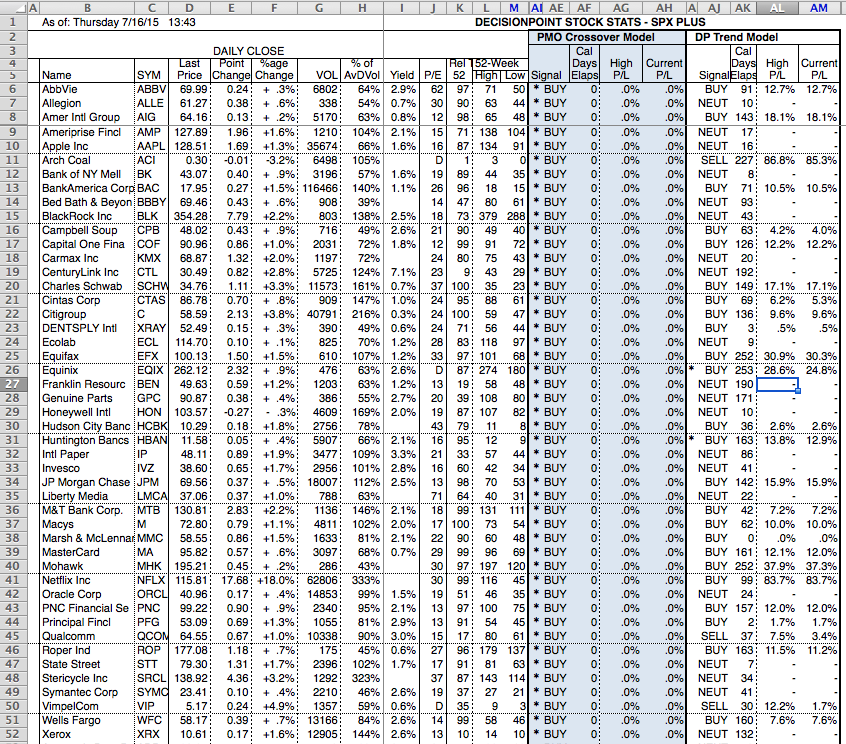
After deciding upon market direction, how do we find stocks that might benefit from that environment? One group of our DecisionPoint publications is spreadsheets, and one of those spreadsheets is called SPX - PLUS. This spreadsheet contains 564 large-cap stocks representing about 80% of the total U.S. market capitalization. They are the stocks which compose the S&P 500, S&P 100, Dow 65 (the 30 Industrials, 20 Transports, and 15 Utilities), and the Nasdaq 100. The "plus" part is that we include a couple of dozen larger-cap S&P 400 stocks to fill in the remaining slots. There are over 45 columns of data, much of it unique. The benefit of a spreadsheet is that you can sort on the various fields and arrange the stocks in groups that help you focus on certain areas. Here's how I used this spreadsheet recently.
I was asked to help test an online trading game. This involved picking about ten stocks for the game, which was to run for the month of July. Okay, it's a game, so I don't want to spend an inordinate amount of time picking the stocks. I downloaded our SPX - PLUS spreadsheet, and sorted it so that new PMO Crossover BUY signals sorted to the top. The PMO section of the spreadsheet is highlighted in the graphic below. (I have closed many of the columns to simplify, and this is from July 16, not the one I used at the beginning of July.)
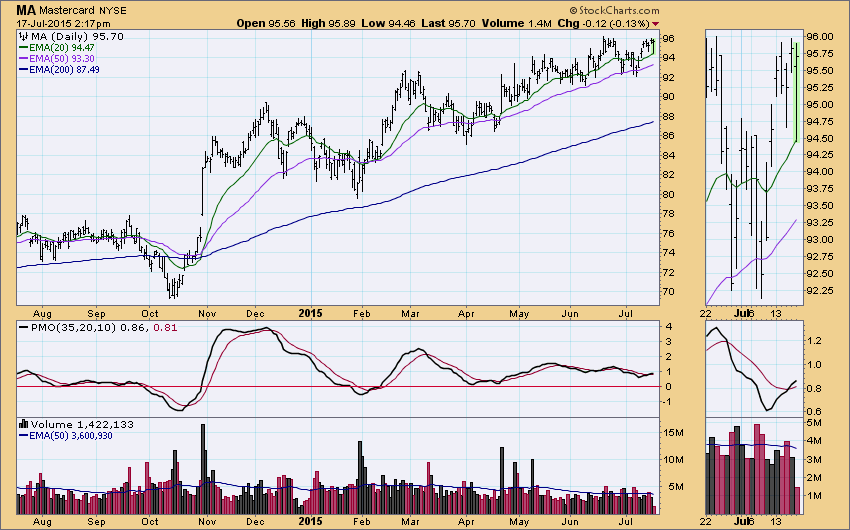
Next, I went through the list, checking the chart for each one in order to find the best looking PMO configurations. Here is an example of one I like. There has been a substantial price correction, the PMO has had a relatively smooth decline into oversold territory, and has formed a smooth clean bottom.
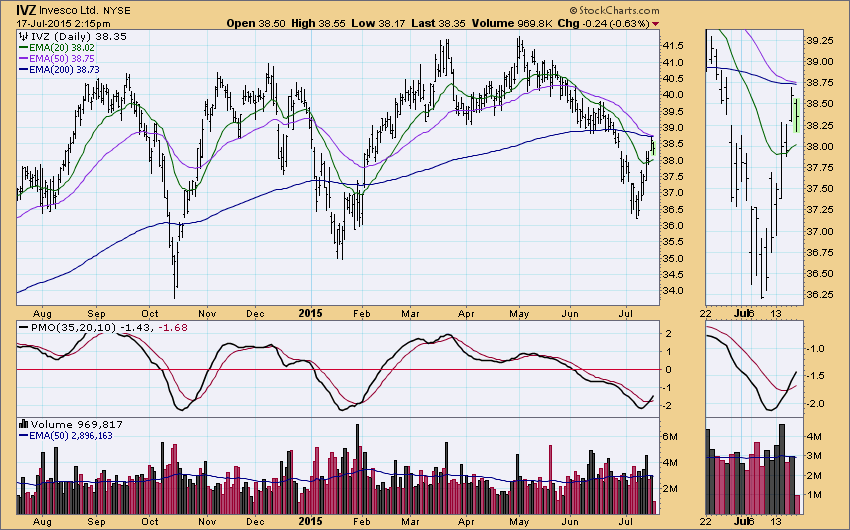
Now here is the kind of chart that I would shy away from. Price is advancing at a labored pace, which is reflected in the flat, jittery PMO movement. The PMO bottom in not at all impressive, except under the magnification of the thumbnail chart.
Using this technique I selected eight stocks for my game portfolio. it took about 30 minutes or less. So far this month my portfolio has been a winner by about two to three percentage points, so I'm hitting the target, but no bulls-eye because I've mostly hung around the fourth rank.
I should emphasize, these are examples of my process, not recommendations. Also, for the purpose of emphasizing the key points of this article, part of the process that I haven't mentioned is that, in addition to determining the trend, we also need to determine the condition of the market. Is it overbought or oversold? For example, in a bull market the trend will most often overcome errors in judgment, but it is usually best to wait for a pullback before opening new longs.
CONCLUSION: It is possible to bet against the trend and win, but the odds increase significantly if we bet with the trend. The DecisionPoint Alert Daily Report can help determine the trend and condition of the market so we know in which direction the market tide is flowing. Then our spreadsheets provide data that can be manipulated in various ways, so as to help us select the best candidates for exploiting the trend.
Technical analysis is a windsock, not a crystal ball.
Happy charting,
Carl


