Hello Fellow ChartWatchers!
The Fed's announcement on Thursday was the big news of the week both fundamentally and technically. Prior to the announcement, stocks had moved up nicely. After the announcement, those gains were all given back and then some. It was a pivotal moment. In a flash, a promising bullish pattern turned into a very bearish pattern. But before I can show you exactly what I mean, we need to have a quick review of some common chart patterns.
When two groups of people can't agree on the proper price for a stock, prices oscillate between two trendlines - one providing support from the bulls and one providing resistance from the bears. If these two trendlines are converging, they form either a triangle pattern or a wedge pattern. Understanding the difference between the two is very important.
Ascending Triangles:
If the resistance line at the top of the pattern is horizontal and the support line underneath is rising, an Ascending Triangle pattern forms. Here is a simplified picture of that pattern:
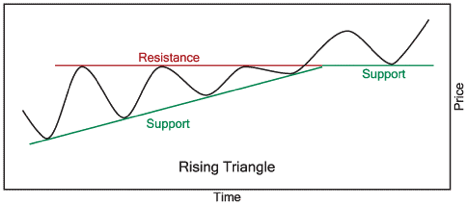
As the picture shows, Ascending Triangles often resolve to the upside with the rising trendline eventually overcoming the overhead resistance.
Symmetric Triangles:
If, on the other hand, the resistance is stronger and creates a downtrend line - while support has formed a rising trendline, a Symmetric Triangle pattern forms. Here's a picture of that pattern:
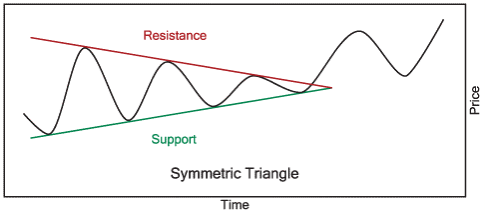
The resolution of a symmetric triangle is much less predictable however it is usually considered a "consolidation pattern" means that it will break in the direction of the trend that was in effect before the pattern appeared.
Rising Wedges:
If both the resistance line and the support line are rising - and the support line is rising faster than the resistance line - then a Rising Wedge pattern forms. Here's a picture of that pattern:
(Sorry - still working on the "diagram" version for this pattern.)
A Rising Wedge typically forms during a "reaction rally" following a significant downtrend. Because of that, it often results in a downward break and a continuation of the previous downtrend.
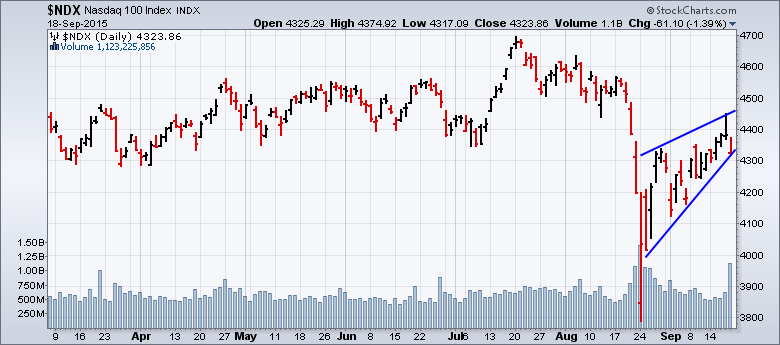
So, why am I telling you all this? Well... look at the date on the Nasdaq 100 chart above. That's a current chart. The key question is "Is that rising wedge real?"
Up until Thursday afternoon, that pattern looked more like an Ascending Triangle pattern with a horizontal resistance line around 4350. Similar patterns had also appeared on the S&P 500 and Dow charts. However, the market's negative reaction to the Fed's announcement has made the case for a Rising Wedge pattern much stronger. And that doesn't bode well for next week.
The fact is, you will be hard pressed to find any bullishness amongst the StockCharts Market Commentators at the moment. (Keep reading this newsletter to see what I mean.) They, and I, are all very concerned about the markets as we head into October.
Be careful out there - it is time for tight stops.
- Chip
P.S. Be sure to listen to my interview with Dr. Alexander Elder on this weekend's edition of ChartWatchers LIVE.


