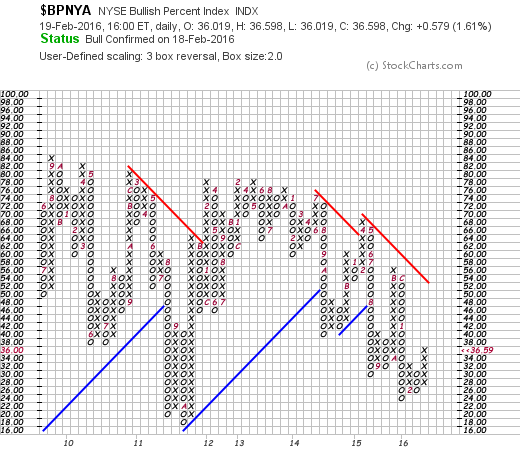
One of the widely watched gauges of market direction is the NYSE Bullish Percent Index ($BPNYA). That index measures the percent of NYSE stocks that are in point & figure uptrends. Chart 1 shows a point & figure version of that index. [P&F charts show alternating columns of Xs and Os. X columns show rising prices, while O columns show falling prices]. Readings over 70% are overbought, while readings below 30% are oversold. The index reached an oversold low of 24% during January. The chart also shows the BPNYA in a potential support zone formed during the 2011 selloff. Here's the good news. The last X column has risen to 36% and has exceeded the previous X column at 32%. That constitutes a p&f buy signal. [A P&F buy signal occurs when a rising X column exceeds a previous X column]. That's an encouraging sign.
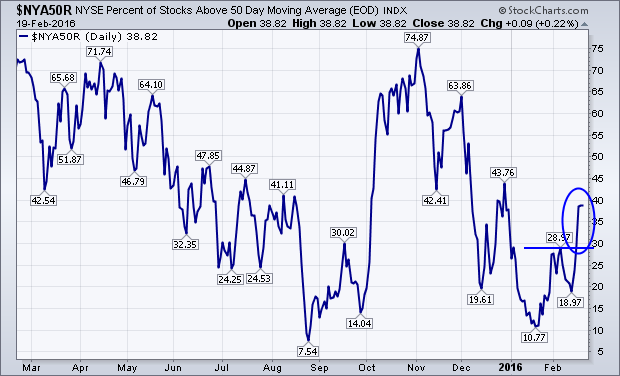
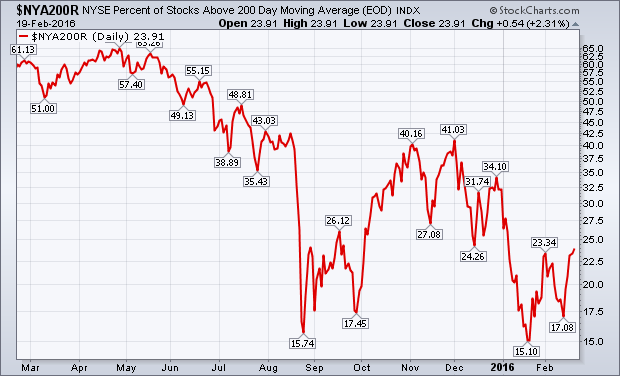
 Two other measures of market direction are the percent of NYSE stocks above their moving average lines. They too are starting to show improvement. The blue line in Chart 2 plots the percent of NYSE stocks above their 50-day average. That line reached oversold territory below 20% last August and again this January. It has risen during February to 38% which is the highest level this year. The red line in Chart 3 plots the percent of NYSE stocks above their 200-day average. It too is starting to rebound from oversold territory below 20% for the second time. It needs a decisive close above its early Febuary peak at 23% to turn its short-term trend higher. The blue line has already done that. The position of both lines suggests a stock market that is attempting to form a bottom.