Hello Fellow ChartWatchers!
After an unexpectedly quick rise in stock prices this week, the markets are poised for a showdown. It's too bad we can't have the stock market be more like an athletic event...
In this corner, weighing in at 200-days in length, our long-term, bearish tag team champions - the masters of disaster - "Rounding Top Formation" and "200-day Moving Average!" (The crowd boos loudly. The champions don't care.)
And in the other corner, only 15-days old, the young upstarts - the great bullish hope - the uptrend that up-ends - "Four-Day Rally" and "MAC-Daddy Crossover!" (The crowd chants "Up-Trend! Up-Trend! Up-Trend!")
Let's take a closer look at the "boxing ring" for this week's fight:
 Unfortunately, I can only stretch the boxing/wrestling metaphor so far. But you get the idea. There is a HUGE collision about to happen in the market. It will actually be sort of fun watching it happen next week.
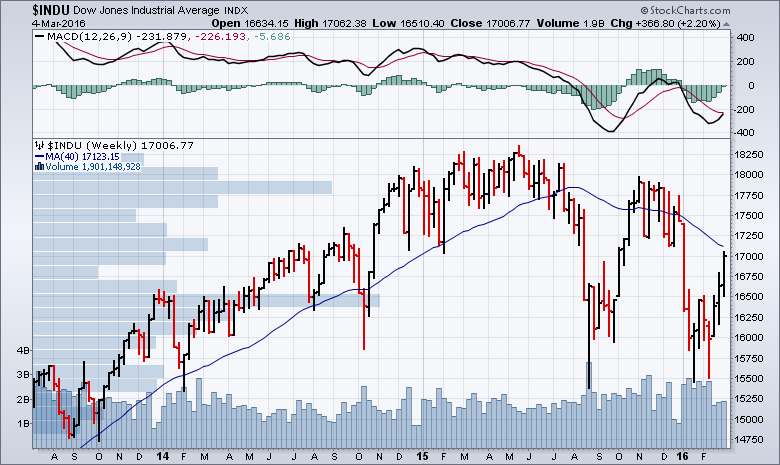
That blue line is the 40-week (aka 200-day) moving average for the Dow Industrials. The key question for next week is "Can the Dow move above that moving average?" Typically, as you can see in the past, the market slows down and changes direction whenever it approaches that average. It put the brakes on the big uptrend back in October. It also reversed numerous pull-backs during the long uptrend in 2014 and 2015. So the odds are things will slow down and reverse (at least temporarily) next week.
Other things working against our upstart uptrend include the 17,000 level, low volume for the past 3 weeks, and the resistance area between 17,000 and 17,250. (See the horizontal volume-by-price bar sticking out from the left side of the chart around that level?)
But - as they say in the sports world - "That's why they play the game" meaning that you can't take anything for granted. While the odds are against it, there's a change the sharp uptrend will continue. If it does continue, how high could it go?
First, the further above the 200-day MA it goes, the more likely it be that it will pull back to that average. Second, there is a huge overhead resistance zone just above 17,750. I'm having a hard time seeing things go that high anytime soon.
Again, the more likely scenario is what Clubber Lang called "Pain" - a reversal at the 200-day Moving Average followed by a new leg down.
Definitely "rocky" times ahead for the market. (Pun definitely intended.)
- Chip


