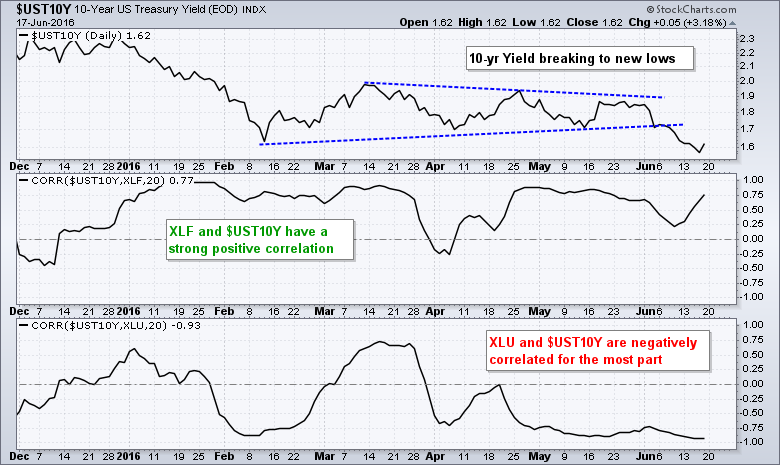
A sharp decline in Treasury yields is lifting the Utilities SPDR (XLU) and weighing on the Finance SPDR (XLF). First, let's look at the correlations to better understand the relationships. The chart shows the 10-yr Treasury yield in the top window and the Correlation Coefficients in the lower windows. The Correlation Coefficient ($UST10Y,XLF) is clearly positive and the Correlation Coefficient ($UST10Y,XLU) is mostly negative. This means XLF tends to move in the same direction as the 10-yr Yield and XLU tends to move in the opposite direction.
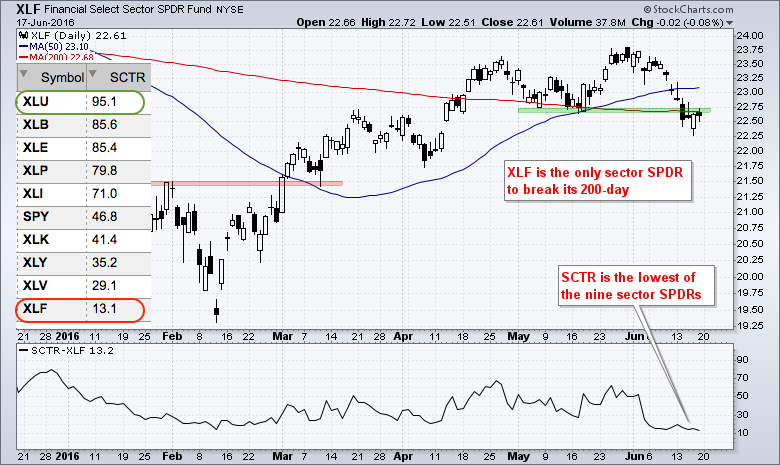
On the price chart, the Finance SPDR (XLF) is the only sector trading below its 200-day SMA as the ETF moved below this key moving average this week. XLF also broke below the mid May lows. Even though the 50-day is still above the 200-day, I would keep a negative bias on this sector unless it can recover and break back above the 50-day (and soon). The indicator window shows the StockCharts Technical Rank (SCTR) below 20 and this shows some serious relative weakness.
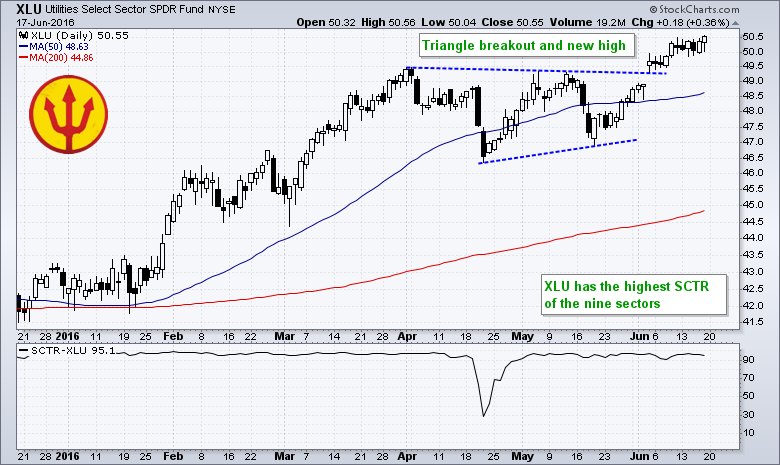
 In contrast to XLF, XLU broke triangle resistance with a gap in early June and closed at a new high on Friday. XLU was the only sector to record a 52-week high on Friday. The indicator window shows the StockCharts Technical Rank (SCTR) moving above 90 in early May and staying there the last seven weeks as XLU leads the sector SPDRs. You can read more about our SCTRs in the ChartSchool.
 ****************************************
Thanks for tuning in and have a great weekend!
--Arthur Hill CMT
Plan your Trade and Trade your Plan
*****************************************


