ChartWatchers

Stock Bounce Fades as Yields and the Dollar Keep Climbing

John Murphy

John Murphy

Chief Technical Analyst, StockCharts.com

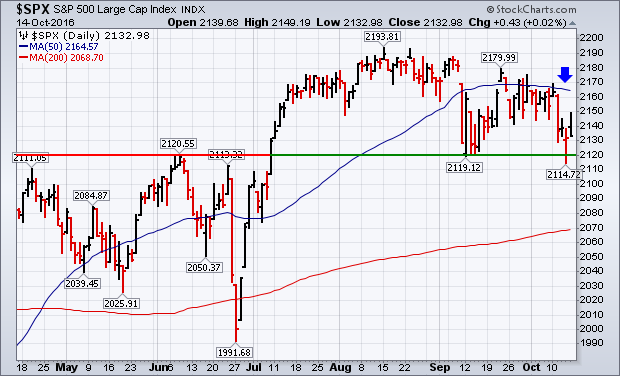
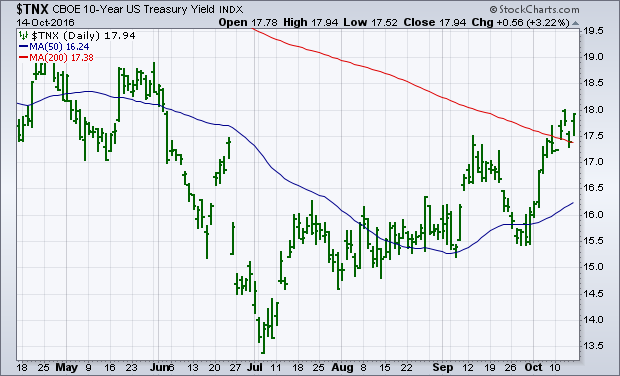
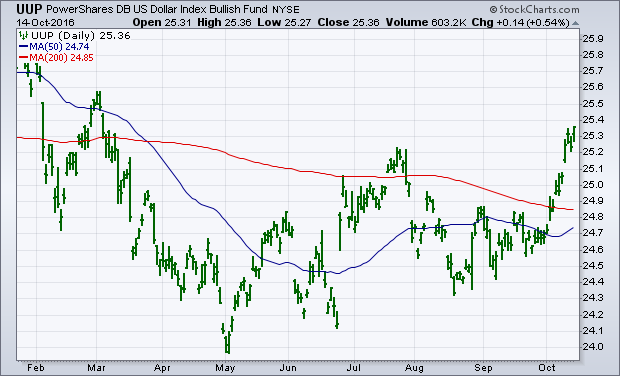
A morning bounce in stocks faded by the end of the day. Chart 1 shows the S&P 500 ending the day at its low. That keeps stocks in a short-term downside correction and well below a falling 50-day average (blue arrow). It also leaves open the possibility that the September low could still be retested. Rising bond yields continue to weigh on stocks. Chart 2 shows the 10-Year Treasury Yield ending the week on a strong note after bouncing off its 200-day moving average. That pushed bond prices lower again. The jump in yields pushed utilities lower while supporting financials. Rising Treasury yields continue to push the dollar higher. Chart 3 shows the U.S. Dollar Index (UUP) ending the week at a seven-month closing high. That's also weighing on large cap stocks.

John Murphy
About the author: is the Chief Technical Analyst at StockCharts.com, a renowned author in the investment field and a former technical analyst for CNBC, and is considered the father of inter-market technical analysis. With over 40 years of market experience, he is the author of numerous popular works including “Technical Analysis of the Financial Markets” and “Trading with Intermarket Analysis”. Before joining StockCharts, John was the technical analyst for CNBC-TV for seven years on the popular show Tech Talk, and has authored three best-selling books on the subject: Technical Analysis of the Financial Markets, Trading with Intermarket Analysis and The Visual Investor. Learn More