
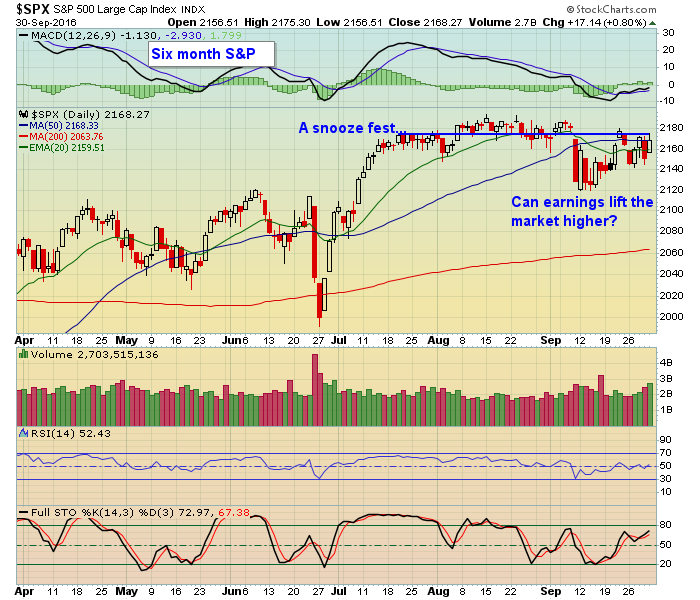
The third quarter has come to an end. It ended on a high note with the S&P gaining 3.3% from the June 30 close to Friday's close. Interestingly, the S&P got to 2168 two weeks into the third quarter which is exactly where it ended on Friday. In other words, if you had gone into a long slumber on July 14 and woke up on September 30, you wouldn't have missed a thing.
 Of course there's no telling how the market will perform between now and the end of October when a good portion of earnings will be reported. But in looking back over the past five years, from September 30 to October 31, here's the results:
2011 - +3.6%
2012 - (-1.9%)
2013 - +4.4%
2014 - +2.3%
2015 - +8.2%
2016 - ???
You can see above that four of the past five years have produced positive results between September 30 and October 31. In fact, last year saw a substantial increase of over 8%.
Even though the S&P has been stuck near the same level for the past 2.5 months it still remains within easy striking range of its all time high. And the NASDAQ has shown particular resiliency as it remains above all key technical levels. This might indicate that traders feel earnings could be solid for the quarter.
The "official" start of earnings season will be October 10 when Alcoa reports its numbers after the bell. Then for the following three to four weeks thousands of companies will report their numbers. We'll be keeping track of those companies that beat earnings and have solid charts so we can provide them to our members as potential high reward to risk trades. If you would like to see a sample of our exclusive "Candidate Tracker" just click here.
At your service,
John Hopkins
EarningsBeats


