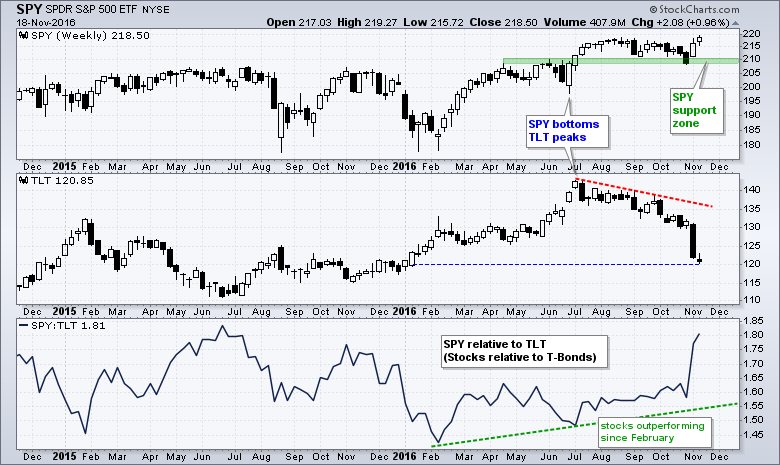
The market began its move to riskier assets in July and this move simply accelerated over the last two weeks. The chart below shows stocks (risk assets) bottoming in late June and Treasury bonds (safe-haven assets) peaking in early July. The S&P 500 SPDR (SPY) hit a new high this week and the 20+ YR T-Bond ETF (TLT) is trading at its lowest level since January. The indicator window shows the price relative (SPY:TLT ratio) bottoming in February, forming a higher low in early July and surging to its highest level since summer of 2015. This means stocks are outperforming T-bonds and this reflects a strong risk appetite in the US markets.
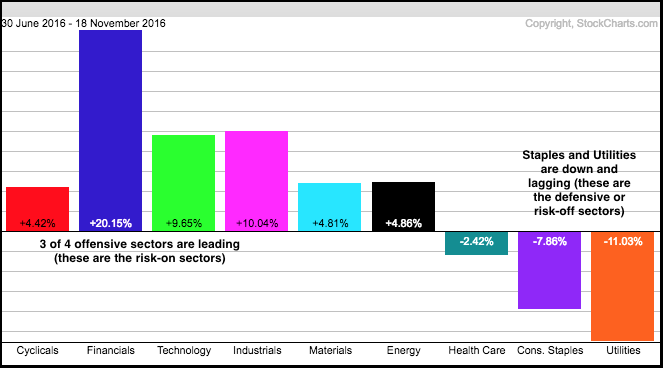
This strong risk appetite is also reflected in sector performance since July. The Utilities SPDR (XLU) and Consumer Staples SPDR (XLP) also peaked in the first part of July and both are down sharply over the last four months. Conversely, three of the four offensive sectors are leading the market with bigger gains than SPY, which is up 4.84% over the last 100 days. Notice that the Finance SPDR (XLF), Technology SPDR (XLK) and Industrials (XLI) are up the most of the nine sectors and clearly leading. The Consumer Discretionary SPDR (XLY) which represents the fourth offensive sector, is up less than SPY and still lagging. Nevertheless, three out of four is enough to support a bull market. XLY is the cyclicals sector in this PerfChart.
 ****************************************
Thanks for tuning in and have a good weekend!
--Arthur Hill CMT
Plan your Trade and Trade your Plan
*****************************************

