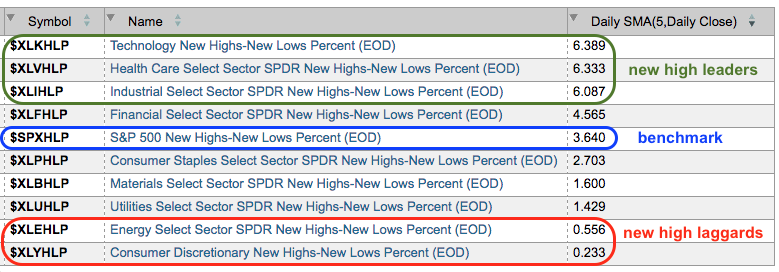
New highs are a sign of underlying strength and chartists can measure this indicator using High-Low Percent. In particular, I like to rank the nine sectors by High-Low Percent or a moving average of High-Low Percent. Note that High-Low Percent equals new highs less new lows divided by total issues. Chartists looking for the weekly leaders in High-Low Percent can look at the 5-day SMA. The table below shows the technology, healthcare and industrials sectors with readings above +6%. As a percentage of component stocks, these three sectors saw the most new highs last week. Consumer discretionary and energy were the weakest because the 5-day SMA of High-Low Percent was below 1%.

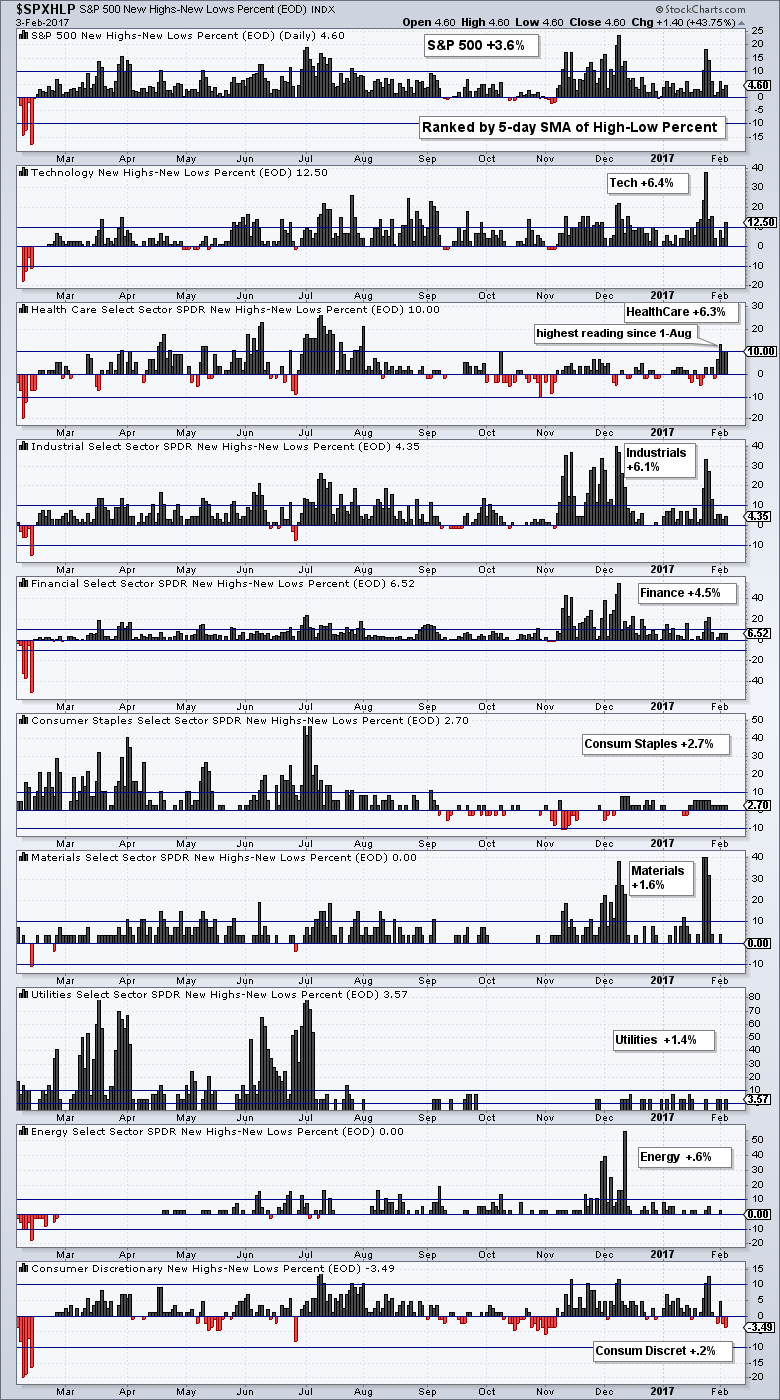
The chart below shows the High-Low Percent indicators as histograms and the sectors are sorted by the 5-day SMA of High-Low Percent. This SMA is not shown on the charts, but I am showing the value for each sector. Tech is leading because the 5-day SMA of XLK High-Low% ($XLKHLP) is at +6.4%. Healthcare High-Low% ($XLVHLP) hit 13.33% on Wednesday and this was the highest reading since August 1st. Consumer discretionary is clearly the weakest sector for internal metrics because High-Low Percent was negative three of the last five days.
****************************************
Thanks for tuning in and have a good weekend!
--Arthur Hill CMT
Plan your Trade and Trade your Plan
*****************************************

