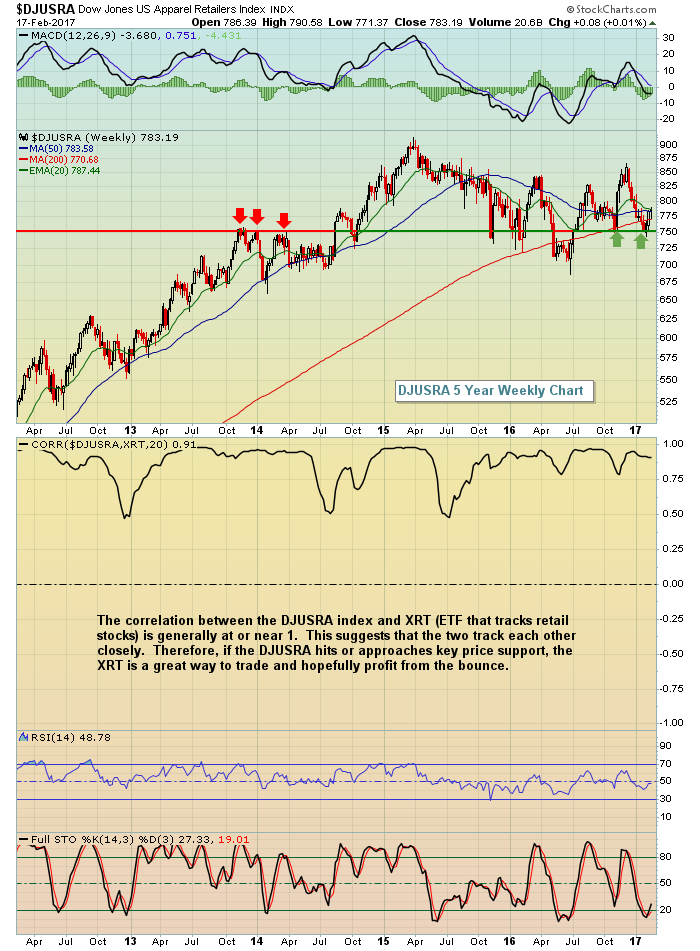
About a month ago, I wrote a ChartWatchers article detailing the bullish historical tendencies of retailers during the months of February, March and April. In particular, apparel retailers ($DJUSRA) have shown tremendous bullishness during the months of February, March and April. In addition, the DJUSRA was approaching a key price support level. As it turns out, that price support held and stocks in this group are beginning to trend higher as they typically do this time of year. First, let's check out the updated chart:
 The XRT remains a great way to trade retail stocks so long as the current uptrend continues. However, if you'd like to take on more risk in an effort to generate higher returns, you can look to individual stocks. There are a few that stand out to me based on their historical tendencies and current technical patterns. Let's discuss them one at a time.
Ross Stores (ROST):
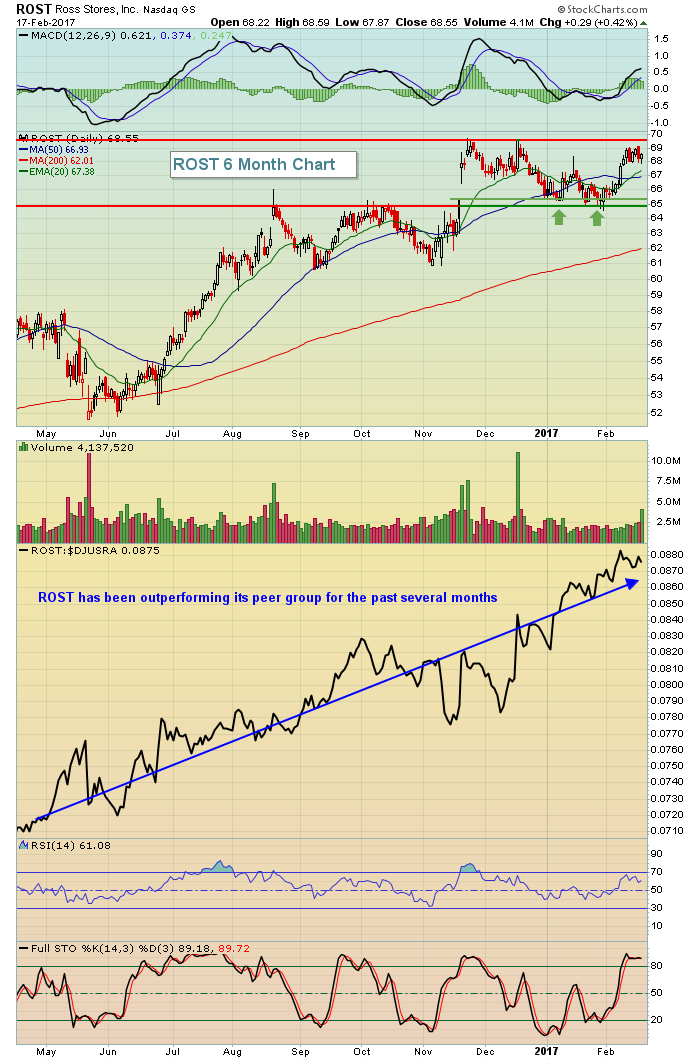
ROST was also featured last month as its price had fallen back into a key gap support zone. Since that time, ROST has bounced roughly 4-5% and still remains in a very bullish pattern:
 Over the past 20 years, ROST has averaged gaining 4.2%, 7.1% and 2.4% during the months of February, March and April, respectively. The current trading range from 65.00-70.00 is a bullish rectangular consolidation pattern, which is more likely to break in the direction of its prior trend - and that trend was clearly higher.
Children's Place (PLCE):
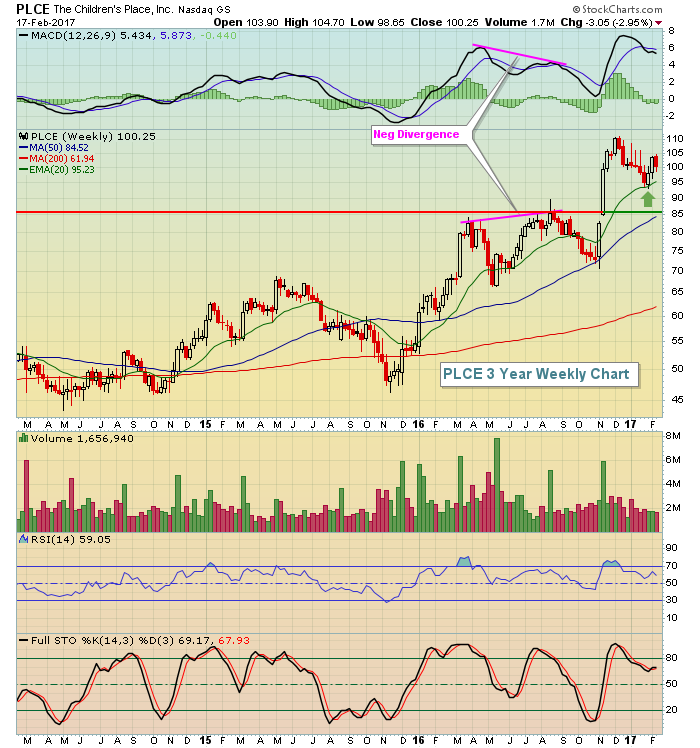
Let's start with the bullish historical tendencies. February is a decent month with PLCE gaining an average of 1.8% during this month over the past 20 years. But that's just beginning the historical strength. March, April and May have produced average gains of 9.3%, 7.6% and 6.0%, respectively since 1997. We're just ten days away from PLCE's best three consecutive calendar months. Oh.....and I did mention the bullish technical conditions? Check this out:
 Volume trends are quite bullish and I love that 20 week EMA test and bounce. Given the strength in the weekly MACD, I'd expect any 20 week EMA test to hold as support.
Foot Locker (FL):
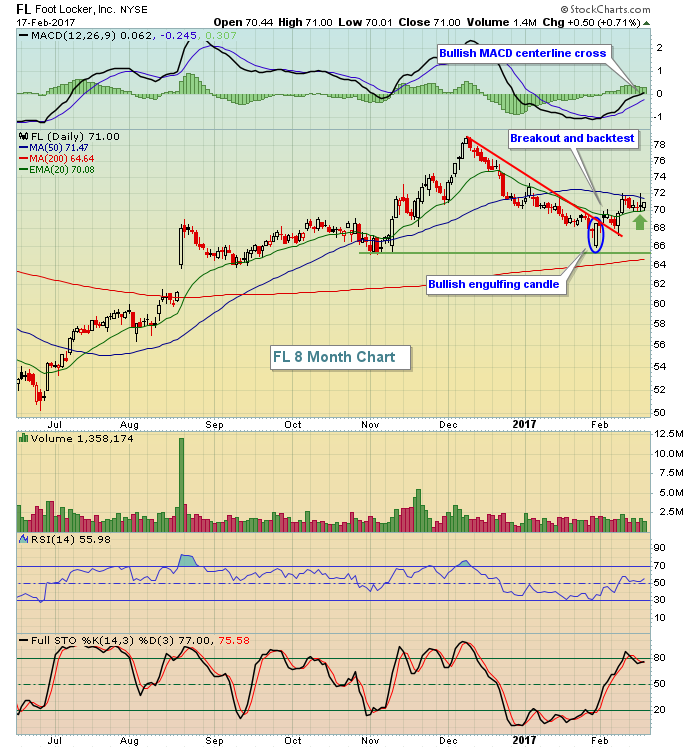
After bottoming in early November, FL went on a tear over the next month, gaining approximately 20% and becoming very overbought before its two month downtrend kicked in. Volume throughout this period of selling was relatively light, but the early November price support held and FL's fortunes turned on its bullish engulfing candle to close out January. Volume has picked up slightly and FL has been holding its rising 20 day EMA on recent short-term profit taking. Here's the visual:
 The green arrow marks the recent 20 day EMA test, which was successful. Price momentum is building, as evidenced by the bullish MACD centerline crossover, so FL looks like a stock just beginning a run to the upside. If history provides any clues, we should see further strength ahead as well. Over the past two decades, FL has posted average monthly returns of 2.6%, 11.5% and 3.7% during February, March and April, respectively. History and technical conditions are both pointing to higher prices ahead.
Happy trading!
Tom
