During the DecisionPoint Report webinars I've added a "chart spotlight". For those of you who were members of the original DecisionPoint website, you probably remember Carl's "Chart Spotlight" on Fridays. Viewers and readers offer up some symbol suggestions via Twitter (@_DecisionPoint) and I determine, based on the chart, whether there is useful information to glean using our trusty Price Momentum Oscillator (PMO) and Trend Models. Last Wednesday a viewer suggested I look at Exxon-Mobil (XOM). It was a great suggestion! Lots of information to be gained looking at the daily and weekly charts for XOM.
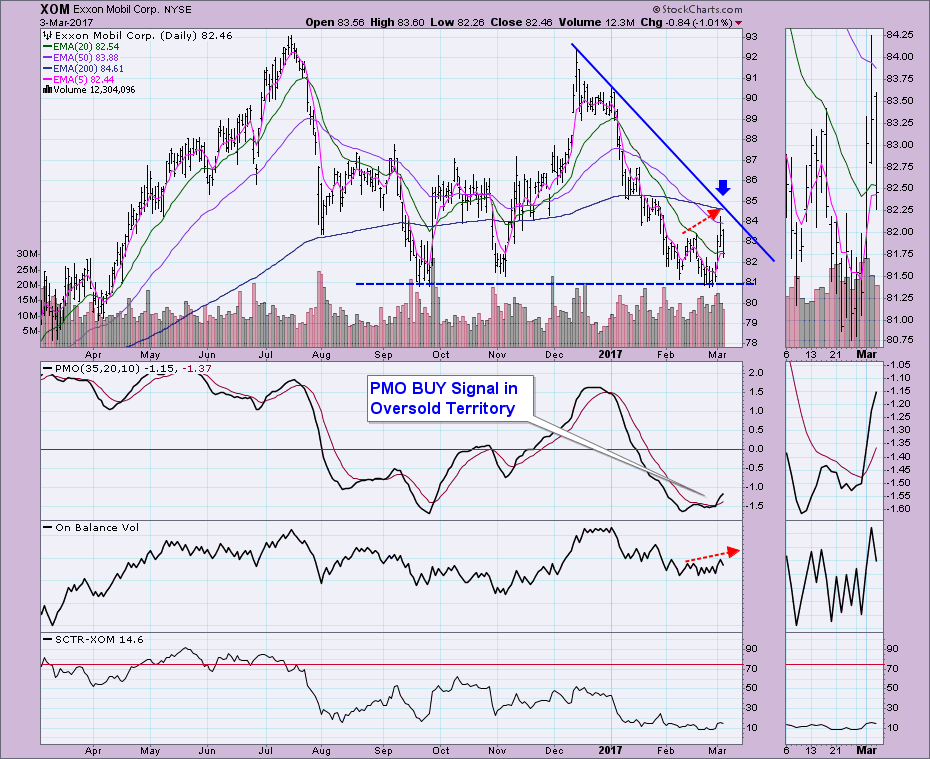
I've annotated a declining tops trendline that is acting as overhead resistance. Note that yesterday after testing that resistance, price fell away. The 50-EMA is below the 200-EMA, a Long-Term Trend Model SELL signal, which means that XOM is in a bear market configuration. Note that the Short-Term Trend Model was unable to generate a BUY signal as the 5-EMA began flattening without a positive crossover the 20-EMA. Alright, so that is the bearish news.
However, the rest of the chart is showing promise. I always like to see a PMO BUY signal in oversold territory. Those signals generally pan out. The last two major tops on the OBV are showing a bullish confirmation to similar price tops. The SCTR has not reawakened, but it isn't flat-lining either. There is opportunity here and it lies at support at $81. Price may be headed to test it once again. If the PMO is correct, this is where I would expect to see a rally begin. This last time out, price didn't break above declining tops resistance, but this new PMO BUY signal suggests it will find success later. If you're already in XOM, a stop just below $81 would be wise.
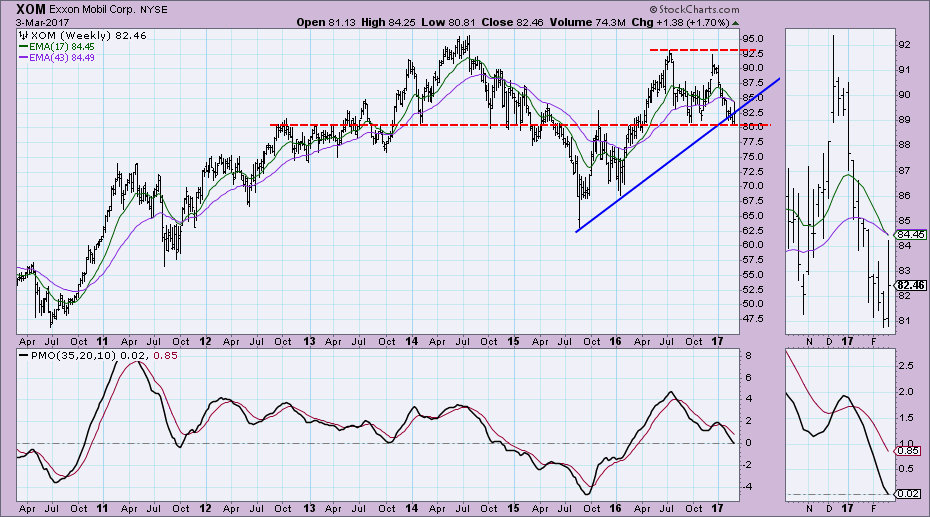
The $80-$81 range is stronger than can be seen on the daily chart. The weekly chart shows that this level has performed well as support. Price technically broke below the rising bottoms trendline, but I think horizontal support is more important, and that held. Of concern is the declining PMO on a SELL signal and the new 17/43-week EMA negative crossover. The PMO is currently sitting in neutral on the zero line. This has been an area we've seen PMO bottoms. If XOM is ready to move out of a bear market, this is the place where the PMO needs to begin decelerating. What I like is that if this support holds, the next area of strong overhead resistance is at $92.50 and I believe that's a reasonable target.
Conclusion: XOM is reaching a "decision point". The daily chart certainly suggests that support at $81 should hold and provide a springboard given the new PMO BUY signal in oversold territory. The weekly chart does show us that support, while currently holding, is vulnerable to a breakdown given the PMO is declining on an IT PMO SELL signal. A stop below $80 or $81 would be wise for a short or longer-term investment. If you'd like to hear my analysis, check out my 3/3 DecisionPoint webinar.
The NEW DecisionPoint LIVE public ChartList has launched! Click on the link and you'll find webinar charts annotated just before the program. Additional "chart spotlights" will be included at the top of the list. Be sure and bookmark it!
Come check out the DecisionPoint Report with Erin Heim on Wednesdays and Fridays at 7:00p EST, a fast-paced 30-minute review of the current markets mid-week and week-end. The archives and registration links are on the Homepage under “Webinars”.
Technical Analysis is a windsock, not a crystal ball.
Happy Charting!
- Erin


