
Anyone who trades the market on a regular basis knows how important it is to use whatever tools are available to make important decisions. This includes using charts to determine the strength/weakness of a specific stock, sector or index, zeroing in on key price and technical support/resistance levels and getting a handle on the overall mood of the market. For me one of the key indicators I use to help me make decisions is the VIX, what many know as the market fear meter.
To give you some historical perspective, the all time low on the VIX was near 9.40 in December, 2006, while the all time high was near 90. Last week got as low as 9.56; pretty darn close to the all time low. Traders look at the VIX in one of a few ways. First, when it is extremely low it signals traders are relaxed and in a buying mood. If it's too high then there is a lot of worry and traders get more defensive. However, I have often used the VIX as a contrarian indicator; if it gets too low it shows too much complacency - time to buy - and if it gets too high traders might be too scared - time to sell.
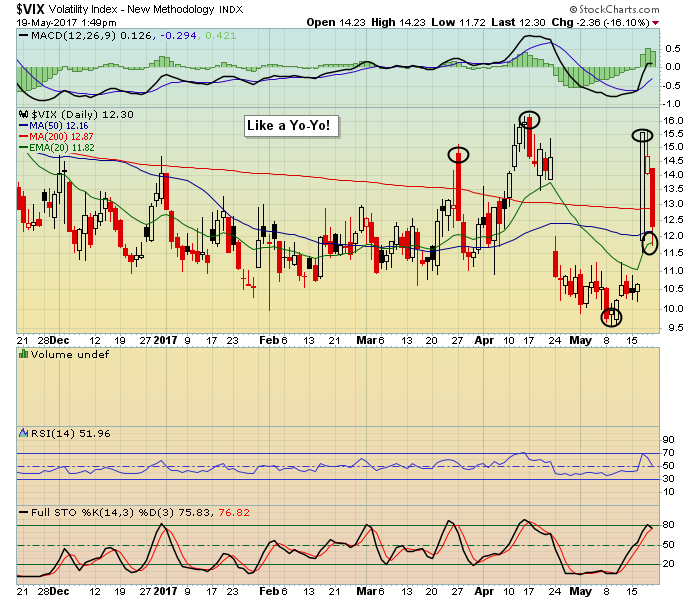
For example, just look at the chart below on the VIX from last week when it neared its all time low. It spiked dramatically as the market sold off sharply on Wednesday. That made sense to me as in looking at the VIX I felt the market had gotten way too complacent; a pullback was overdue, and we got one. I was feeling pretty good having shifted my trading bias to the downside. Now fast forward two days to Friday and lo and behold; the market moved from being scared to being more relaxed. My short bias was short lived!
 When I start seeing big swings in the VIX like we have the past few months the first thing I do is get more defensive as everyone is getting whipsawed, both on the long and short side. This makes it more difficult to come out on top either on the long or short side and can often be painful in the pocket book. The other thing we do at EarningsBeats is scan for companies that look very oversold and have reported strong earnings. These are added to our "Candidate Tracker" and some of these become trade alerts for members. If you would like to see a sample of the Candidate Tracker just click here.
The bottom line to me is this; when volatility picks up like it did last week it makes sense to get more defensive. This can include being much more selective, trimming position size, tightening stops and locking in profits whenever possible. And, for those who flat out want to protect capital at all costs, simply moving to the sidelines until things settle down.
At your service,
John Hopkins
EarningsBeats.com


