
Trading and investing are all about putting the odds in your favor, and chartists can increase their odds with one key assumption: the trend will remain in force until proven otherwise. Coming from the writings of Charles Dow, this assumption means a trend in motion is expected to stay in motion. In other words, assume that the trend will extend, not end. Using a top-down approach, you can incrementally increase your odds of success by starting with the broad market trend, and then extending your trend analysis to the sector, the industry group and the stock. This article will show an example using two classic moving averages to determine the big trend.
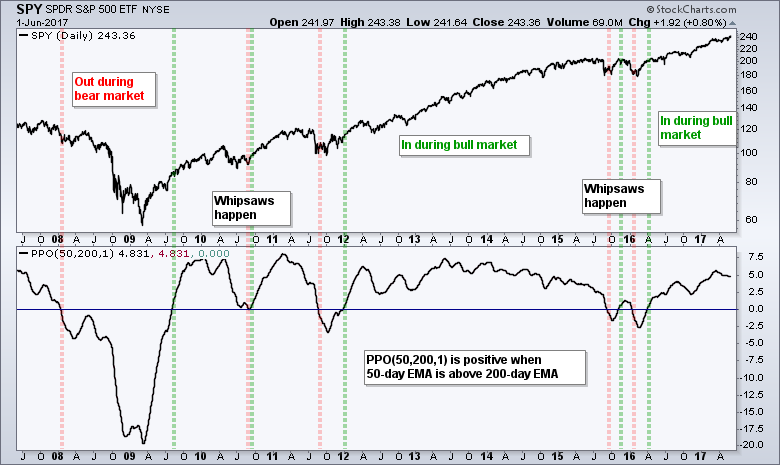
The S&P 500 SPDR (SPY) represents the broader market and we can use the classic 50-day and 200-day moving averages to identify the primary trend. Personally, I prefer exponential moving averages because they put more weight on recent data. In addition, chartists can use the Percentage Price Oscillator (PPO) to measure the difference between two EMAs. The chart below shows the S&P 500 SPDR (SPY) with the PPO(50,200,1) in the indicator window. The red lines show when the PPO turns negative and the green lines show when it turns positive. There were just ten crosses over the last ten years and some whipsaws, but the trends outweighed the whipsaws. The uptrend that started in 2012 lasted over three years and the current uptrend is over a year old.
Chartists can improve their stock picking by extending this trend assumption to the sector, the industry group and the stock itself. The odds are clearly in your favor when the trends are all up. This is easy to chart because StockCharts users can simply enter $SECTOR and $INDUSTRY to plot the sector and industry group for a stock.
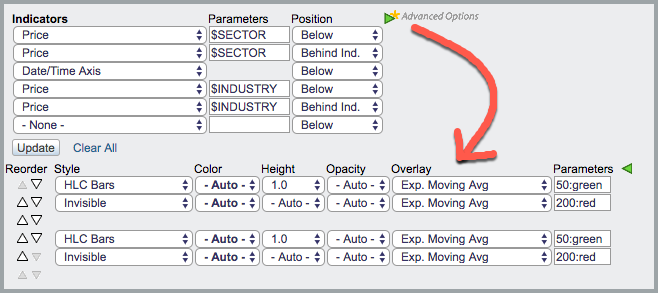
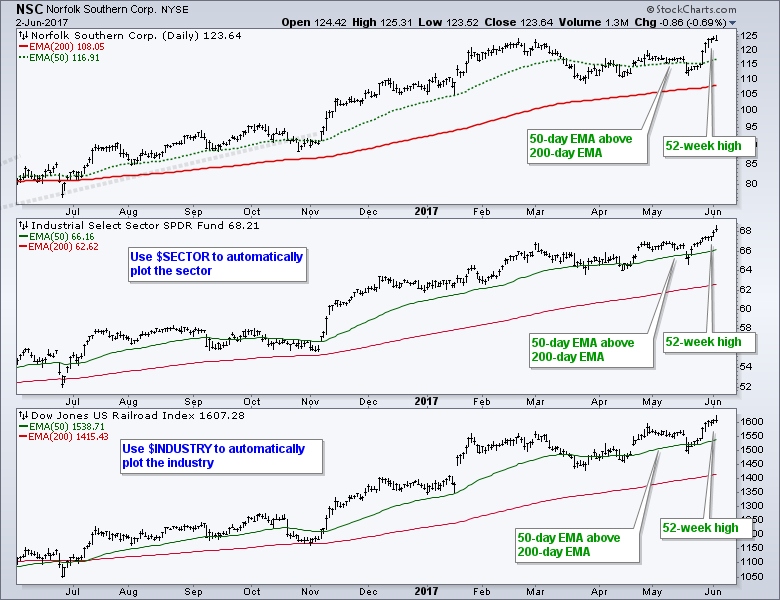 The chart above shows Norfolk Southern (NSC) with the $SECTOR (XLI) and the $INDUSTRY ($DJUSRR). Notice that all three price plots are above their 50-day EMAs and 200-day EMAs, the 50-day EMAs are above the 200-day EMAs for all three, and all three hit new highs this week. The sector, industry group and stock are all in strong uptrends. This is clearly a stock we should watch for bullish setups. The image below shows the SharpChart settings used to create this chart. Notice that I had to add $SECTOR and $INDUSTRY twice for the exponential moving averages, which were set using the advanced settings.
Follow me on Twitter @arthurhill - Keep up with my 140 character commentaries.
****************************************
Thanks for tuning in and have a good day!
--Arthur Hill CMT
Plan your Trade and Trade your Plan
*****************************************


